Fig. 1.
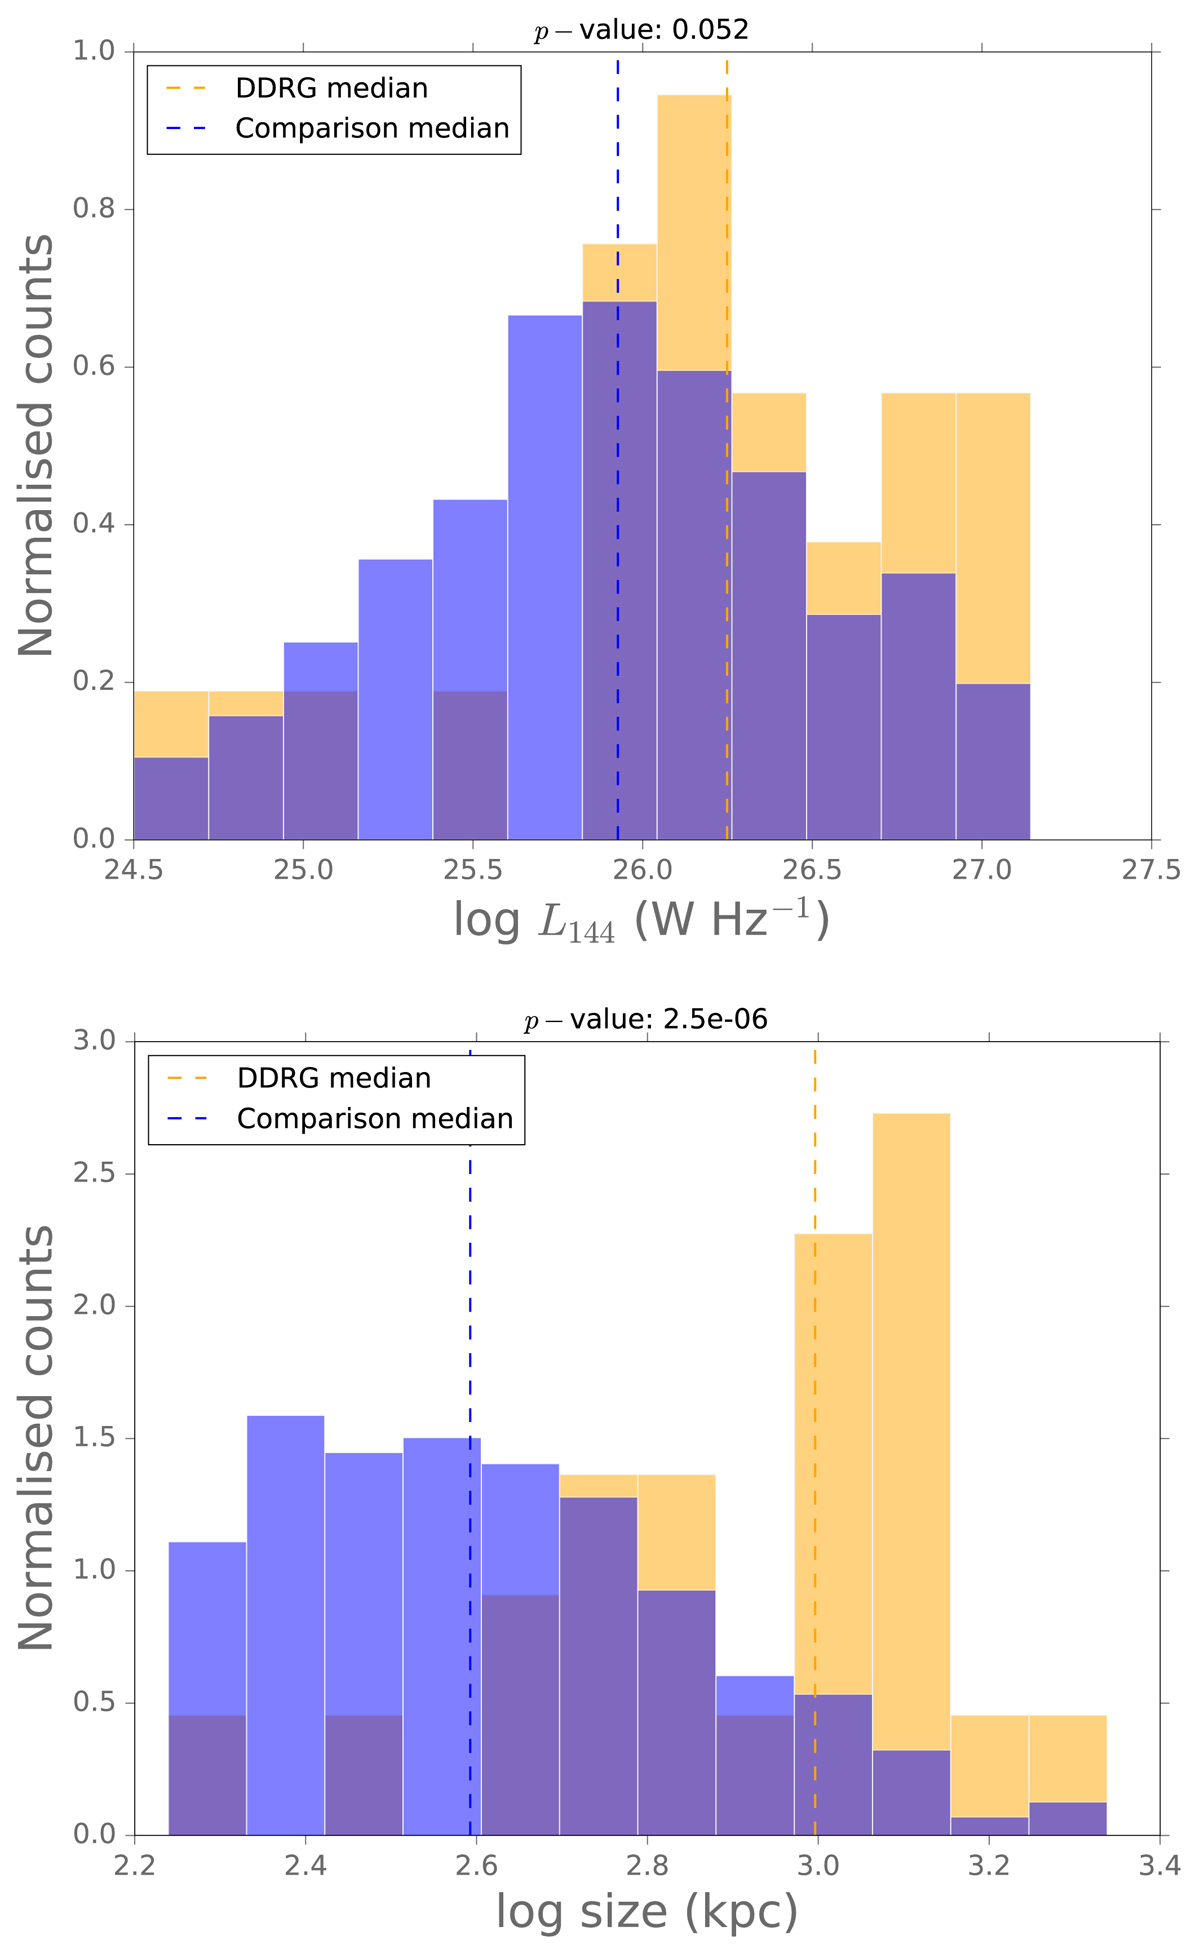
Normalised distributions of total 144 MHz radio luminosity (top panel) and projected total physical sizes in kpc (bottom panel) for our comparison RLAGN (blue; 777 sources) and DDRG (orange; 24 sources) samples. The p-value from a KS test between the two samples is given in the figure heading. The dashed lines show the median values from each sample.
Current usage metrics show cumulative count of Article Views (full-text article views including HTML views, PDF and ePub downloads, according to the available data) and Abstracts Views on Vision4Press platform.
Data correspond to usage on the plateform after 2015. The current usage metrics is available 48-96 hours after online publication and is updated daily on week days.
Initial download of the metrics may take a while.