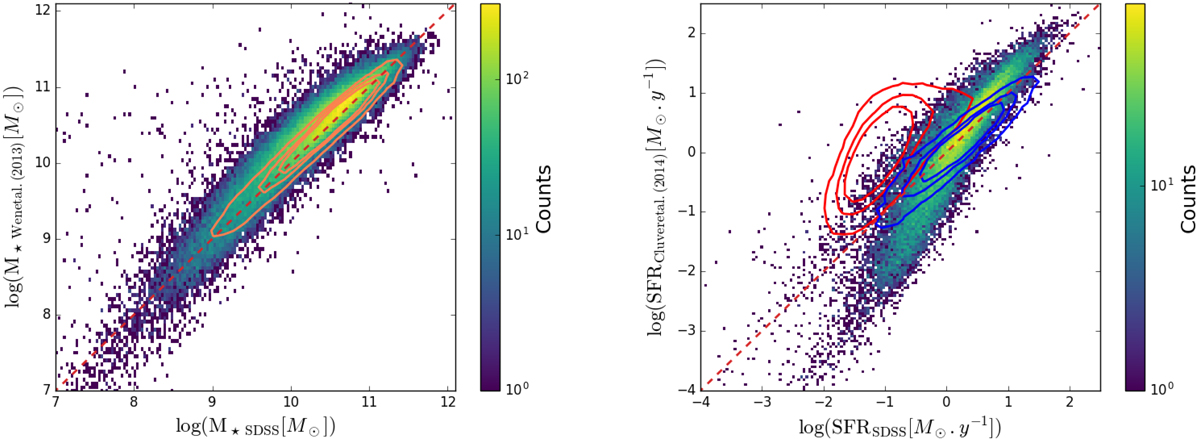
Fig. 14.

Comparisons on the test set. Left panel: M⋆ computed with the method of Wen et al. (2013), using the luminosity in W1, compared with the SDSS masses. The contours show the 1, 3, and 5σ isodensities of the RF results (Fig. 4). Right panel: SFR computed only for star-forming galaxies with the method of Cluver et al. (2014), using the luminosity in W3, compared to SFR from the SDSS catalogue. The blue contours represent the results of the RF for the same population (blue contours in Fig. 7), and the red contours represent the SFR estimation for passive galaxies computed with Cluver’s formula. In both panels, the dashed line represents the one-to-one correlation.
Current usage metrics show cumulative count of Article Views (full-text article views including HTML views, PDF and ePub downloads, according to the available data) and Abstracts Views on Vision4Press platform.
Data correspond to usage on the plateform after 2015. The current usage metrics is available 48-96 hours after online publication and is updated daily on week days.
Initial download of the metrics may take a while.


