Free Access
Fig. 12.
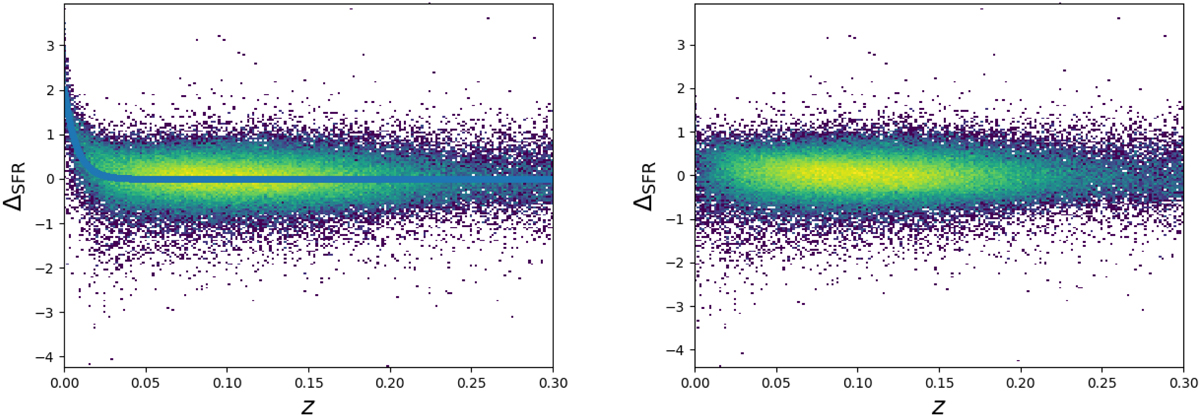
Example of bias induced by the redshift error. Left panel: for σz(1 + z) = 0.015 we show the errors on the SFR estimated values as a function of redshift. The blue line corresponds to the modeled bias. Right panel: same errors as in the left panel but corrected for bias.
Current usage metrics show cumulative count of Article Views (full-text article views including HTML views, PDF and ePub downloads, according to the available data) and Abstracts Views on Vision4Press platform.
Data correspond to usage on the plateform after 2015. The current usage metrics is available 48-96 hours after online publication and is updated daily on week days.
Initial download of the metrics may take a while.