Fig. 11.
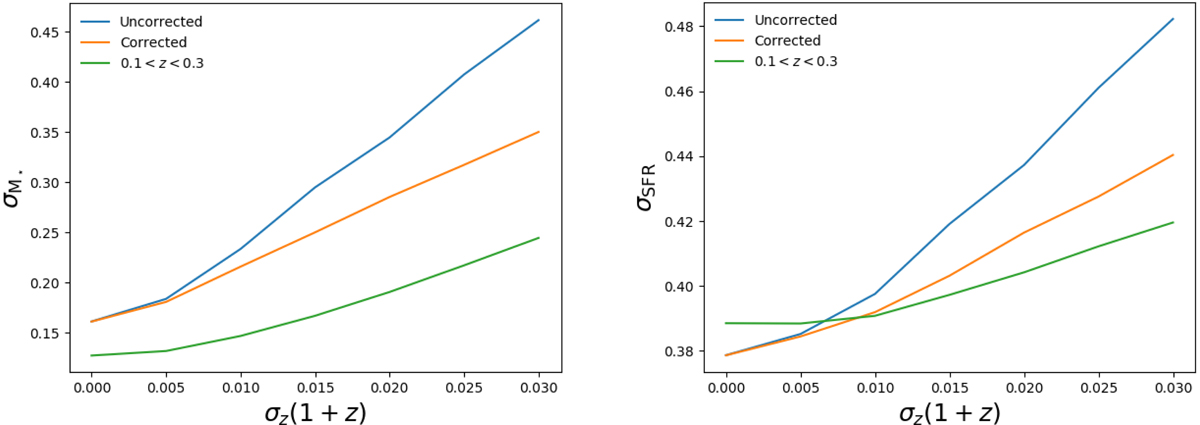
Evolution of the scatters of the estimated properties with the RF as a function of the redshift error. Left panel: scatter for M⋆ estimation. Right panel: scatter for SFR estimation. The blue lines correspond to the scatters corresponding to the whole sample, regardless of the induced bias. The orange lines correspond to the scatters of bias-corrected properties following the laws in Fig. 13. The green lines correspond to the scatters in the redshift range 0.1 < z < 0.3.
Current usage metrics show cumulative count of Article Views (full-text article views including HTML views, PDF and ePub downloads, according to the available data) and Abstracts Views on Vision4Press platform.
Data correspond to usage on the plateform after 2015. The current usage metrics is available 48-96 hours after online publication and is updated daily on week days.
Initial download of the metrics may take a while.