Fig. 1.
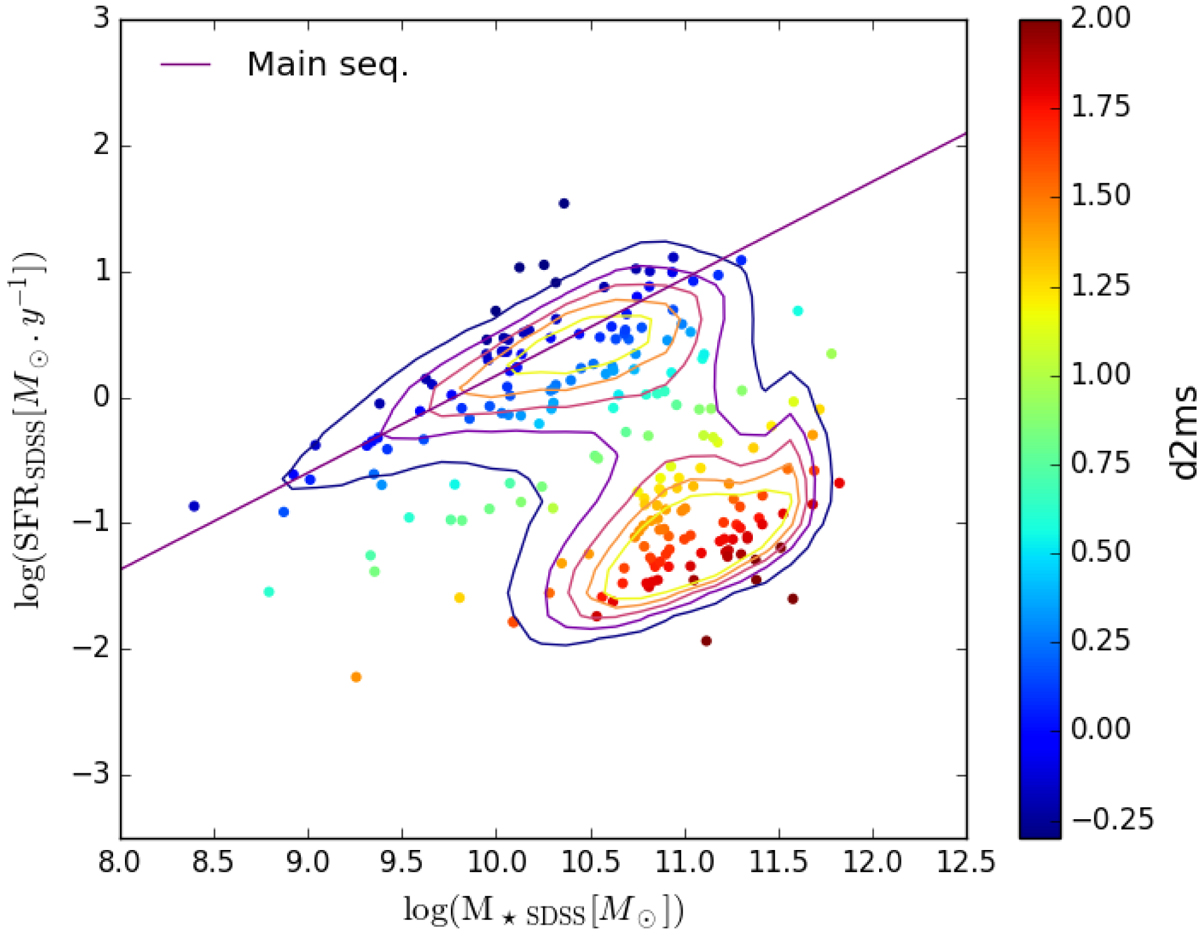
SFR vs. M⋆ diagram. The contours represent the 1σ to 5σ isodensities of all the SDSS MPA-JHU DR8 values from the training sample. The dots are 100 random galaxies taken in the catalogue. The purple solid line is the main sequence of star forming galaxies given by Elbaz et al. (2007). The colours of the galaxies are a function of the distance to the main sequence, d2ms, and are directly representative of the passivity of the galaxies.
Current usage metrics show cumulative count of Article Views (full-text article views including HTML views, PDF and ePub downloads, according to the available data) and Abstracts Views on Vision4Press platform.
Data correspond to usage on the plateform after 2015. The current usage metrics is available 48-96 hours after online publication and is updated daily on week days.
Initial download of the metrics may take a while.