Fig. 7.
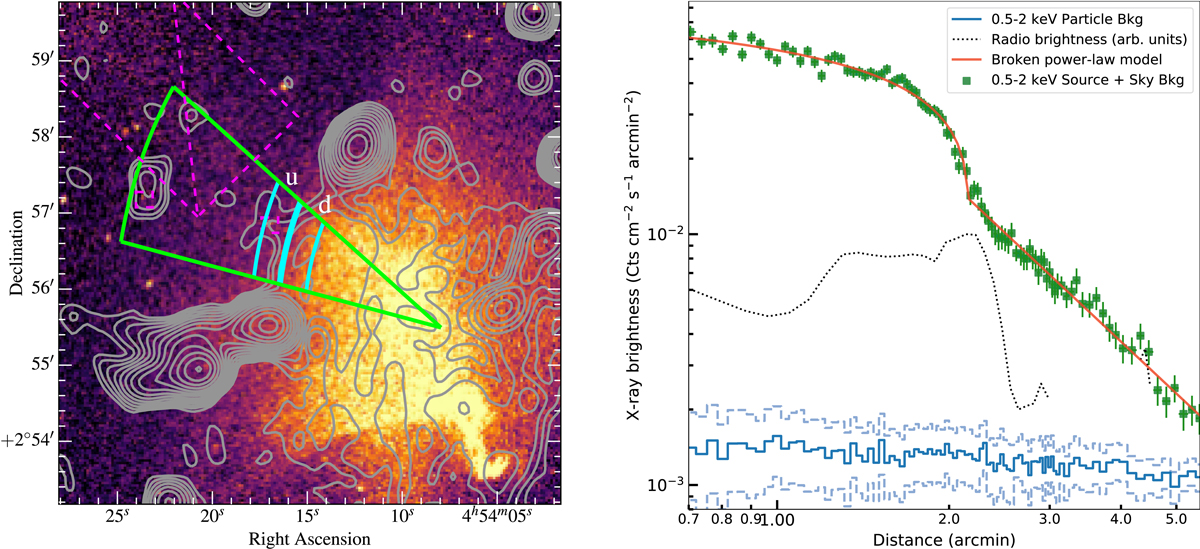
Left panel: sector where SB are extracted from the Chandra X-ray data. The magenta dashed regions are masked to remove the point sources and the emission from the NE plasma that is falling into the cluster. The blue regions represent where temperature is calculated for upstream and downstream ICM regions. Right panel: SB profile towards the NE region and the best-fit radial SB profile (red).
Current usage metrics show cumulative count of Article Views (full-text article views including HTML views, PDF and ePub downloads, according to the available data) and Abstracts Views on Vision4Press platform.
Data correspond to usage on the plateform after 2015. The current usage metrics is available 48-96 hours after online publication and is updated daily on week days.
Initial download of the metrics may take a while.