Fig. 5.
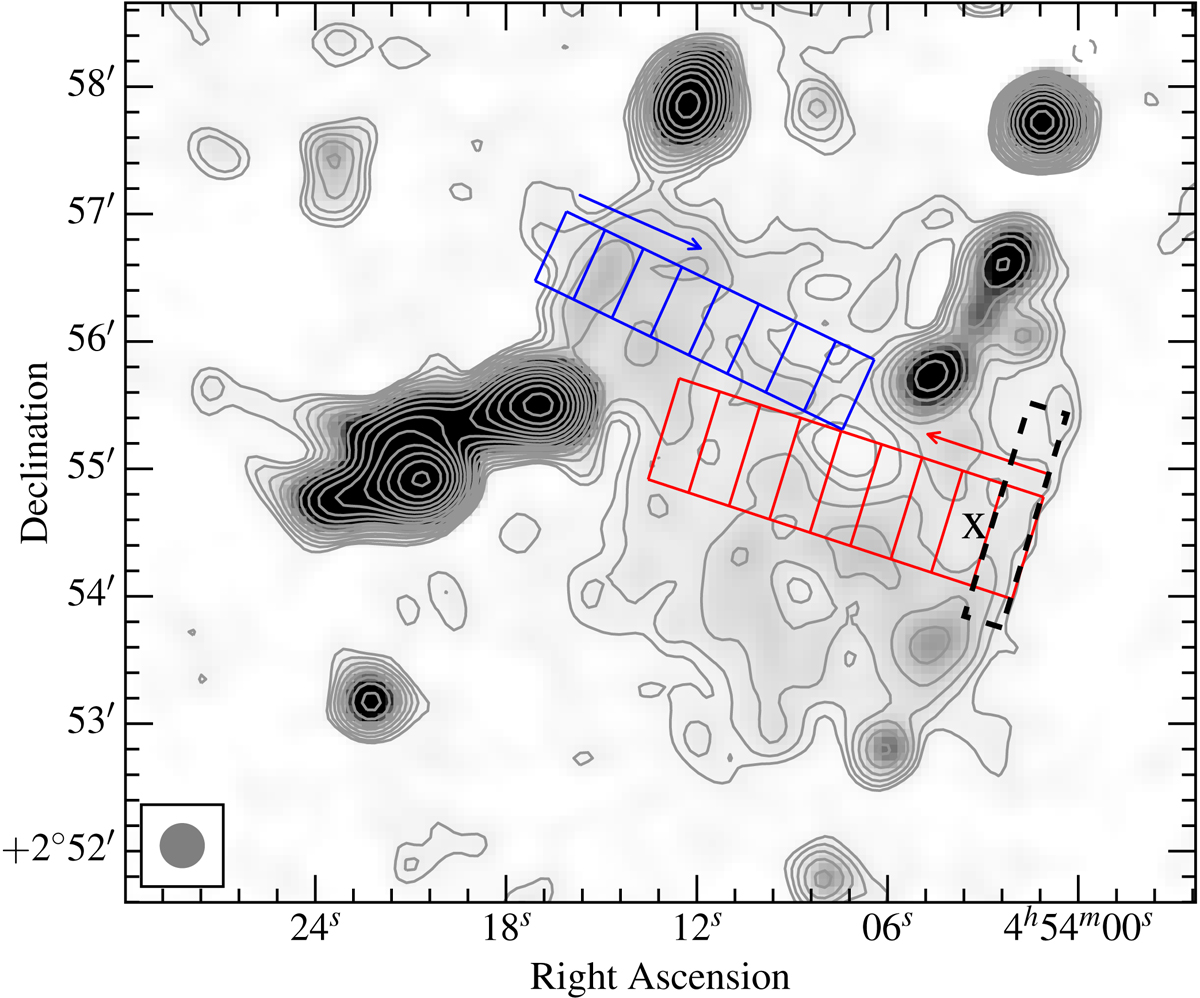
Rectangular regions in the SW and NE directions where SB and spectral indices are plotted in Fig. 6. The black dashed rectangle is where the spectral index right behind the SW shock is estimated. The X cross indicates the location of a compact source I that is subtracted from the VLA data. The VLA contours are identical to those in Fig. 1 (right).
Current usage metrics show cumulative count of Article Views (full-text article views including HTML views, PDF and ePub downloads, according to the available data) and Abstracts Views on Vision4Press platform.
Data correspond to usage on the plateform after 2015. The current usage metrics is available 48-96 hours after online publication and is updated daily on week days.
Initial download of the metrics may take a while.