Fig. 3.
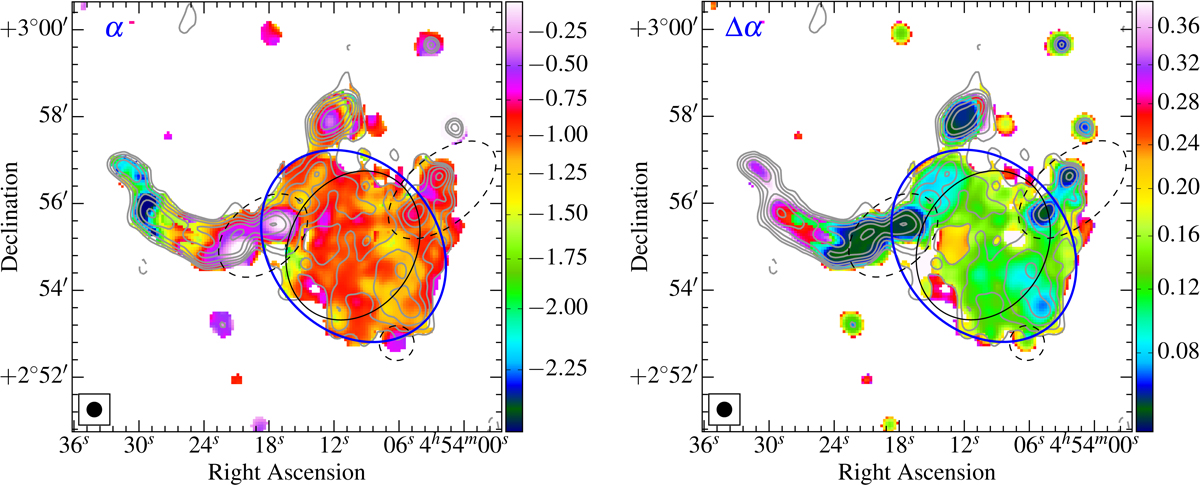
Spectral index from 145 MHz to 1.5 GHz (left panel) and error (right panel) maps of A520. In the both panels, the blue thick ellipse roughly follows the 3σ contour of the halo emission. The black thin ellipse shows the inner region of the halo. The black dashed regions are masked. The LOFAR contours begin with 3σ, where σ = 450 μJy beam−1, and are spaced with ![]() .
.
Current usage metrics show cumulative count of Article Views (full-text article views including HTML views, PDF and ePub downloads, according to the available data) and Abstracts Views on Vision4Press platform.
Data correspond to usage on the plateform after 2015. The current usage metrics is available 48-96 hours after online publication and is updated daily on week days.
Initial download of the metrics may take a while.