Fig. 1.
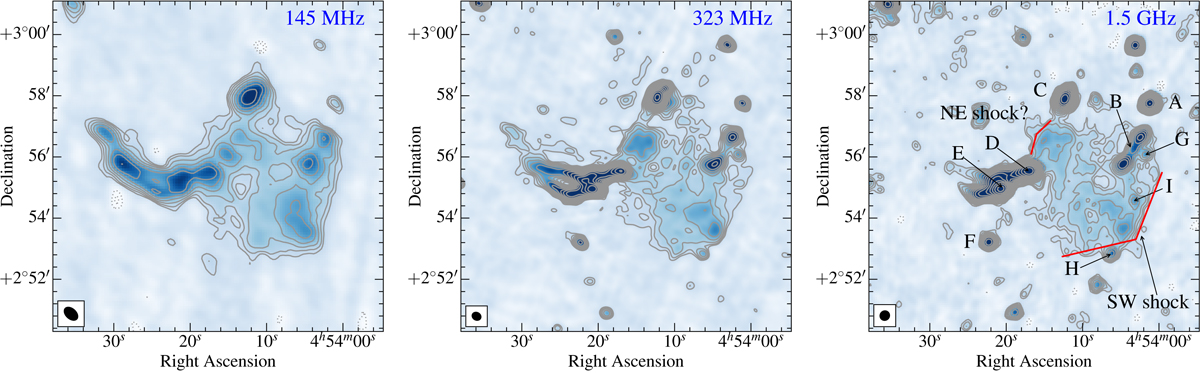
Radio continuum images of A520. The contours are from ±3σ and are spaced by ![]() . The image noise is σ = 460, 100, and 26 μJy beam−1 for the LOFAR, GMRT, and VLA images, respectively. The sources are labelled in the VLA image, partly adapting the notation in Vacca et al. (2014). The synthesised beams are shown in the bottom left corners.
. The image noise is σ = 460, 100, and 26 μJy beam−1 for the LOFAR, GMRT, and VLA images, respectively. The sources are labelled in the VLA image, partly adapting the notation in Vacca et al. (2014). The synthesised beams are shown in the bottom left corners.
Current usage metrics show cumulative count of Article Views (full-text article views including HTML views, PDF and ePub downloads, according to the available data) and Abstracts Views on Vision4Press platform.
Data correspond to usage on the plateform after 2015. The current usage metrics is available 48-96 hours after online publication and is updated daily on week days.
Initial download of the metrics may take a while.