Fig. 9.
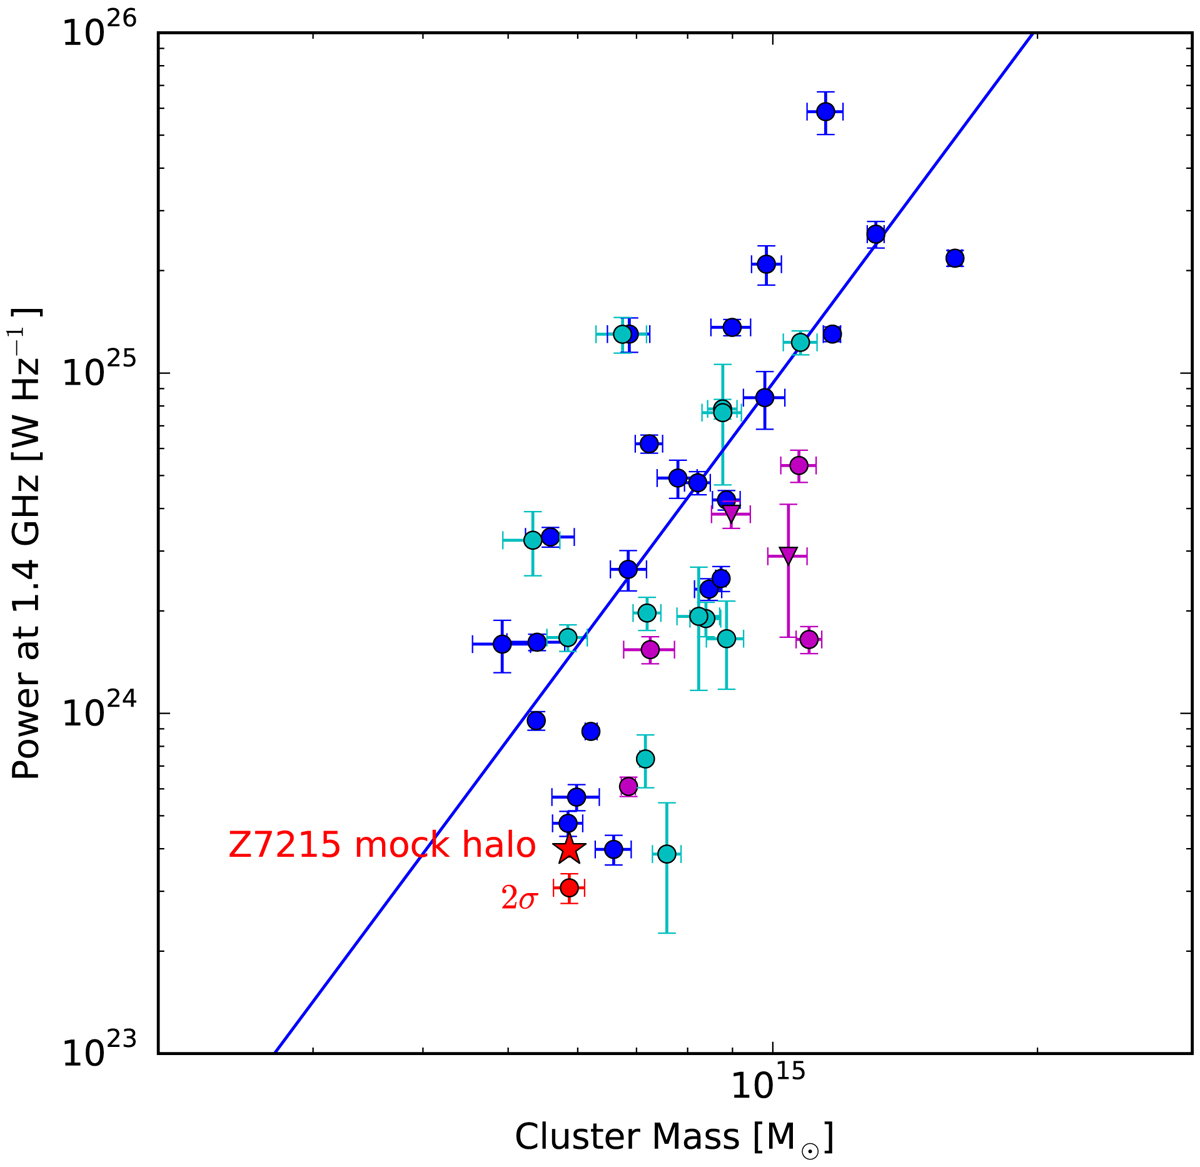
Sample of radio haloes plotted by their radio power at 1.4 GHz vs. their cluster mass (M500 – as determined from Planck observations). The sample of haloes and their correlation is reproduced from Martinez Aviles et al. (2016). Haloes with flux measured at 1.4 GHz are indicated by blue circles and their derived fit is shown as a blue line. Cyan circles represent haloes with flux measured at frequencies other than 1.4 GHz. Magenta circles represent ultra-steep haloes, and magenta triangles represent ultra-steep haloes with flux measured at frequencies other than 1.4 GHz. The red point shows the power computed from the emission detected in our LOFAR observation for Z7215. The red star indicates the power of our mock halo with a higher injected flux value. All halo powers include a k-correction with an averaged spectral index of α = −1.3, as in Martinez Aviles et al. (2016).
Current usage metrics show cumulative count of Article Views (full-text article views including HTML views, PDF and ePub downloads, according to the available data) and Abstracts Views on Vision4Press platform.
Data correspond to usage on the plateform after 2015. The current usage metrics is available 48-96 hours after online publication and is updated daily on week days.
Initial download of the metrics may take a while.