Fig. 1.
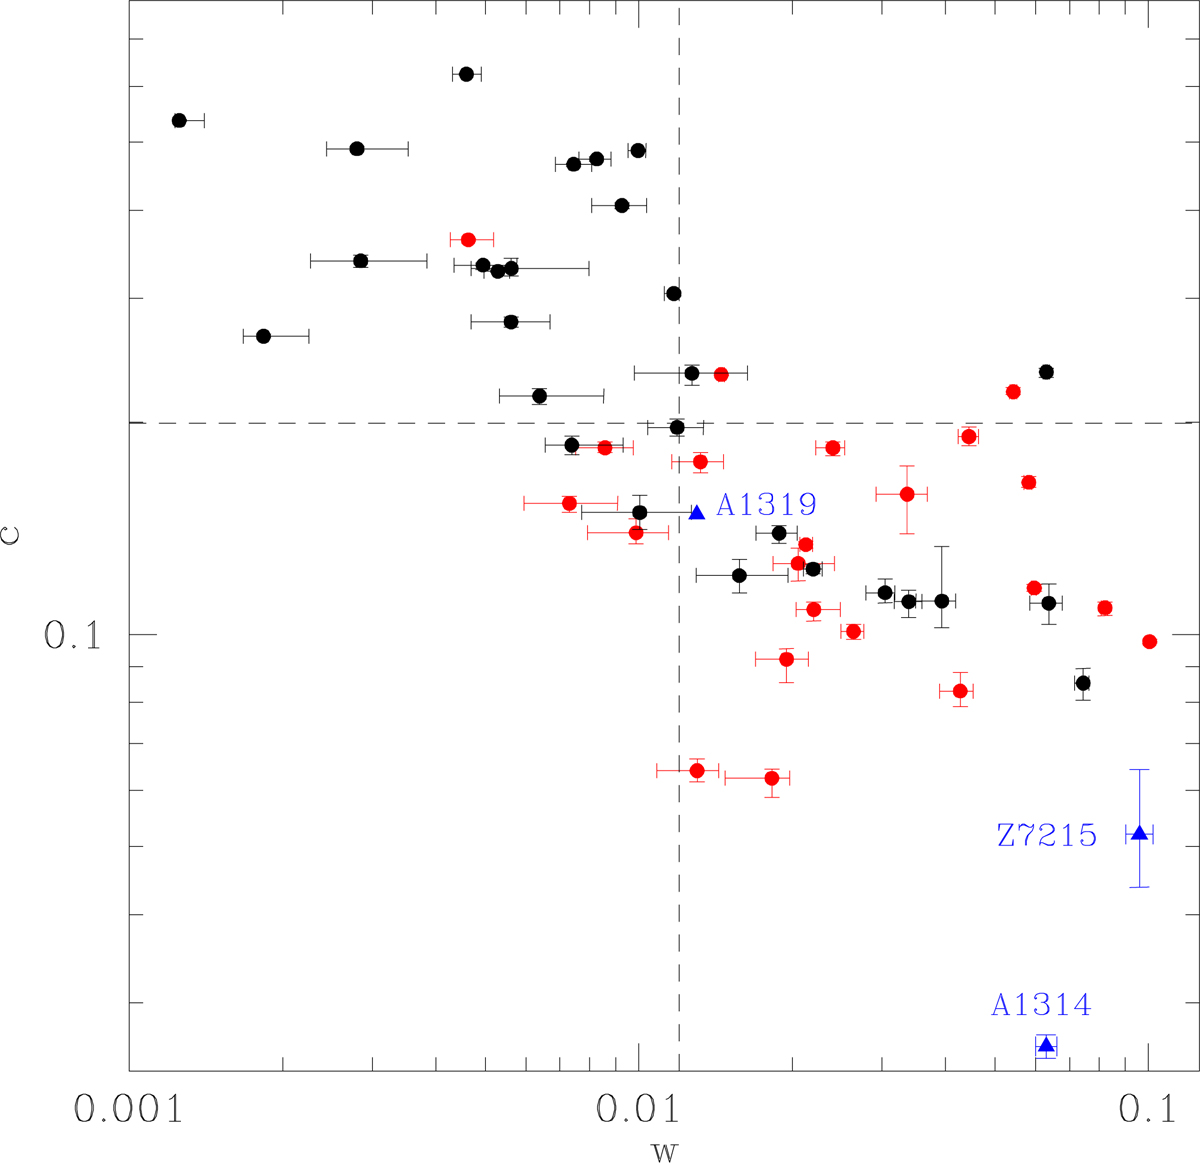
Sample of clusters with masses > 6 × 10¹⁴ M⊙ plotted by their concentration parameter c vs. their centroid shift w from Cuciti et al. (2015). Red dots indicate clusters hosting radio haloes and black dots indicate clusters without radio haloes. The three blue points represent Abell 1314, Abell 1319, and Z7215. The w and c parameters of all clusters are computed from Chandra X-ray images, except for Abell 1314 and Z7215, which have parameters computed from XMM-Newton images. Our selected clusters have masses lower than the sample from Cuciti et al. (2015).
Current usage metrics show cumulative count of Article Views (full-text article views including HTML views, PDF and ePub downloads, according to the available data) and Abstracts Views on Vision4Press platform.
Data correspond to usage on the plateform after 2015. The current usage metrics is available 48-96 hours after online publication and is updated daily on week days.
Initial download of the metrics may take a while.