Fig. 6.
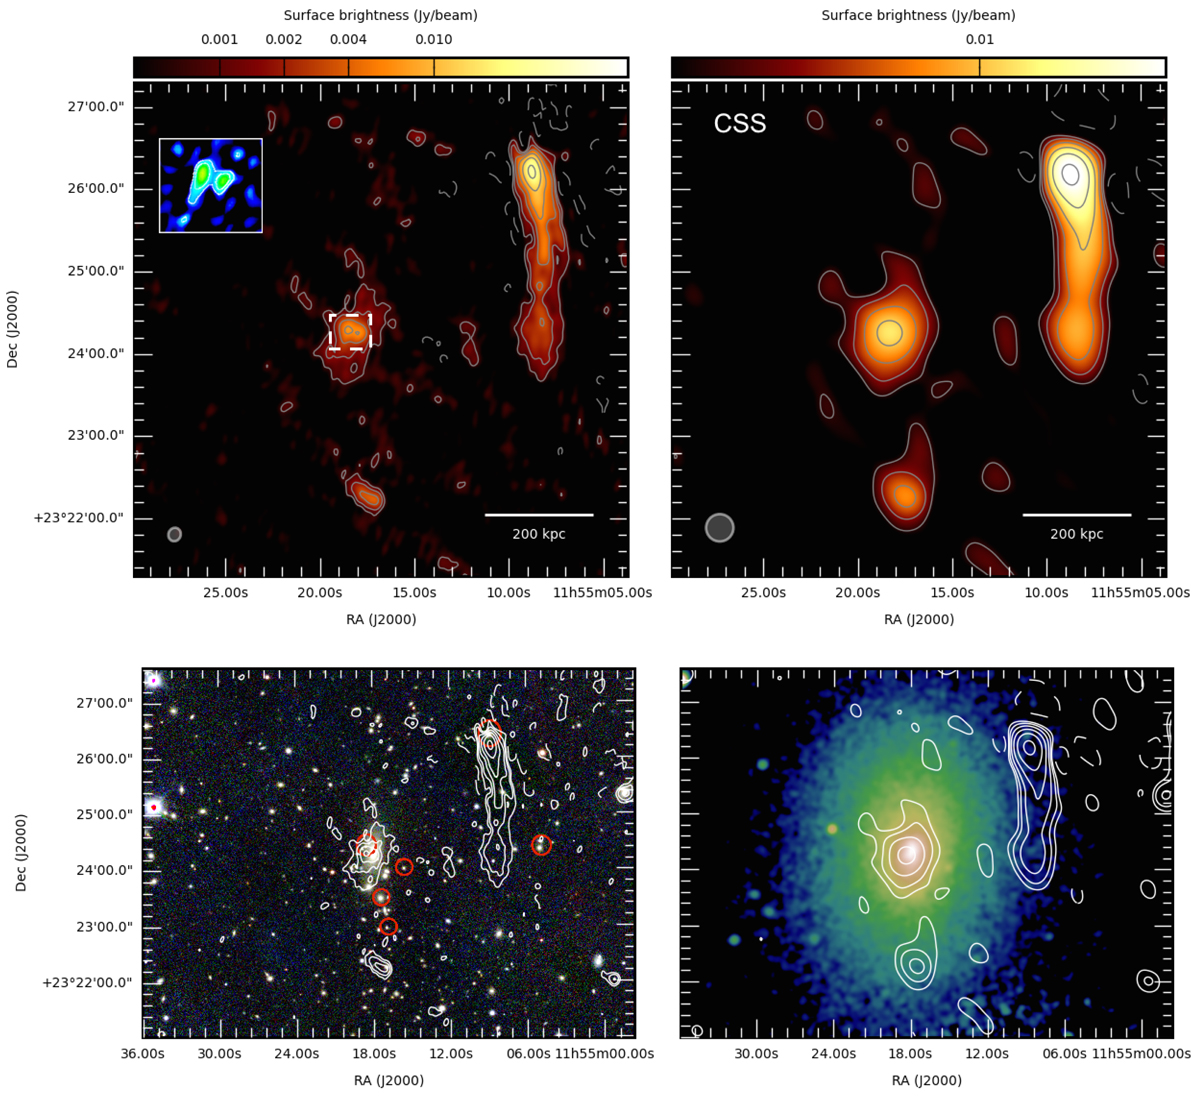
A1413. Top left panel: high-resolution 144 MHz LOFAR image of A1413. The contour levels start at 3σ, where σ = 270 μJy beam−1, and are spaced by a factor of two. The negative contour level at −3σ is overlaid with a dashed line. The beam is 10′′ × 9′′ and is shown in grey in the bottom left corner of the image. The insert box shows the uv-cut high-resolution image of the central sources that are subtracted to obtained the image in top right panel. Top right panel: low-resolution 144 MHz LOFAR image of A1413. The contour levels start at 3σ, where σ = 450 μJy beam−1, and are spaced by a factor of two. The negative contour level at −3σ is overlaid with a dashed line. The beam is 20′′ × 20′′ and is shown in grey in the bottom left corner of the image. This image was obtained after the CSS with a taper of 20′′ and Briggs weighting (robust = 0). Bottom left panel: optical SDSS image of A1413 with the high-resolution (10′′ × 9′′) 144 MHz LOFAR contours overlaid. The red circles indicate the cluster-member galaxies with available spectroscopic redshift. Bottom right panel: Chandra X-ray image of A1413 smoothed on a scale of 5′′ with the low-resolution (20′′ × 20′′) 144 MHz LOFAR contours overlaid.
Current usage metrics show cumulative count of Article Views (full-text article views including HTML views, PDF and ePub downloads, according to the available data) and Abstracts Views on Vision4Press platform.
Data correspond to usage on the plateform after 2015. The current usage metrics is available 48-96 hours after online publication and is updated daily on week days.
Initial download of the metrics may take a while.