Fig. 5.
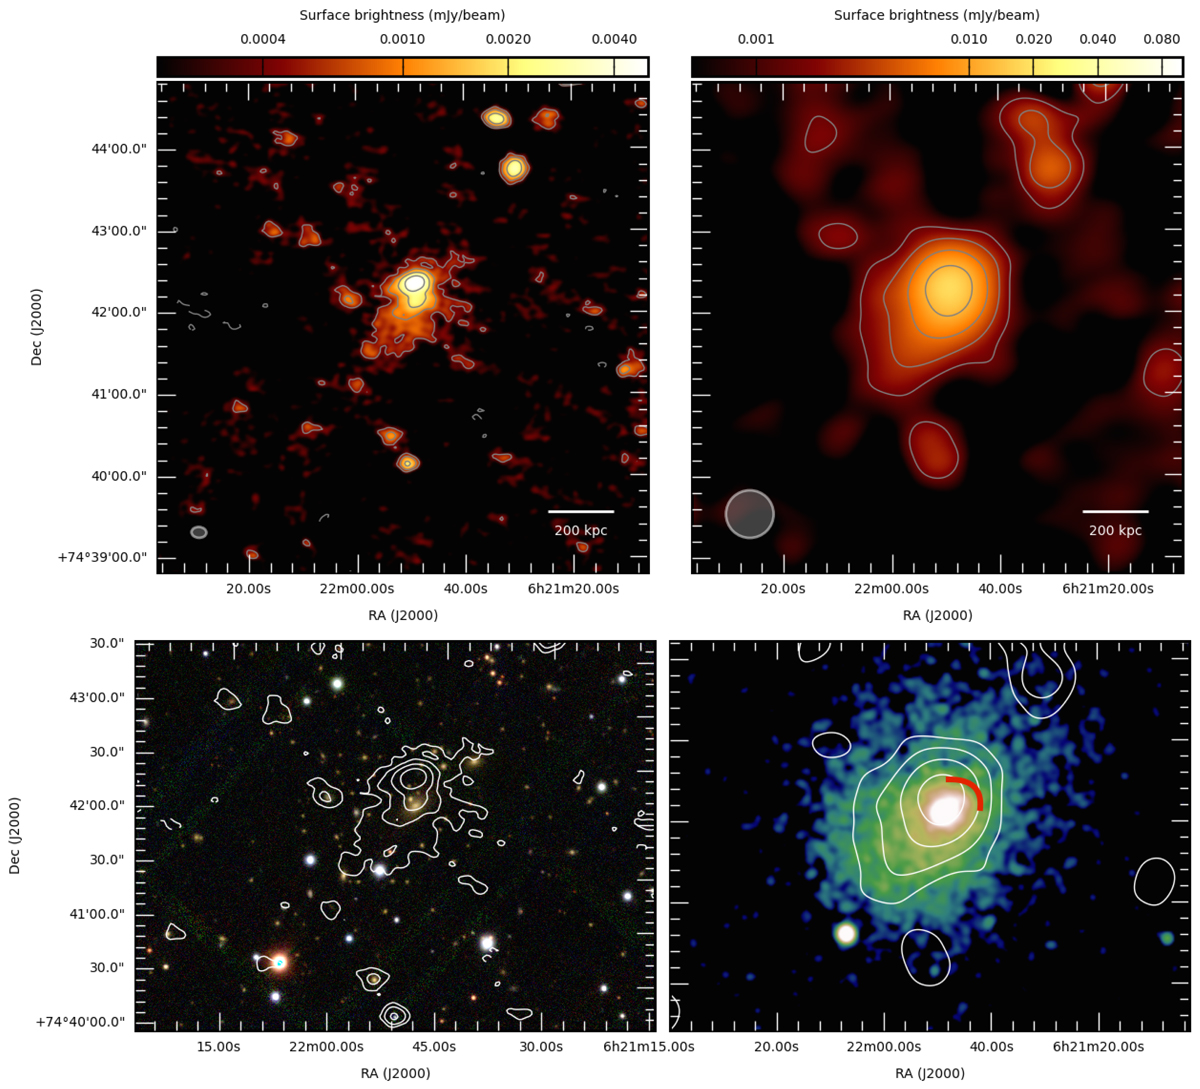
PSZ1G139.61+24. Top left panel: high-resolution 144 MHz LOFAR image of PSZ1G139.61+24. The contour levels start at 3σ, where σ = 150 μJy beam−1, and are spaced by a factor of two. The negative contour level at −3σ is overlaid with a dashed line. The beam is 11′′ × 8′′ and is shown in grey in the bottom left corner of the image. Top right panel: low-resolution 144 MHz LOFAR image of PSZ1G139.61+24. The contour levels start at 3σ, where σ = 500 μJy beam−1, and are spaced by a factor of two. The negative contour level at −3σ is overlaid with a dashed line. The beam is 35′′ × 35′′ and is shown in grey in the bottom left corner of the image. Bottom left panel: optical Pan-STARRS image of PSZ1G139.61+24 with the high-resolution (11′′ × 8′′) 144 MHz LOFAR contours overlaid. Bottom right panel: Chandra X-ray image of PSZ1G139.61+24 smoothed on a scale of 6′′ with the low-resolution (35′′ × 35′′) 144 MHz LOFAR contours overlaid. The red arc indicates the position of the cold front found by Savini et al. (2018a).
Current usage metrics show cumulative count of Article Views (full-text article views including HTML views, PDF and ePub downloads, according to the available data) and Abstracts Views on Vision4Press platform.
Data correspond to usage on the plateform after 2015. The current usage metrics is available 48-96 hours after online publication and is updated daily on week days.
Initial download of the metrics may take a while.