Fig. A.1.
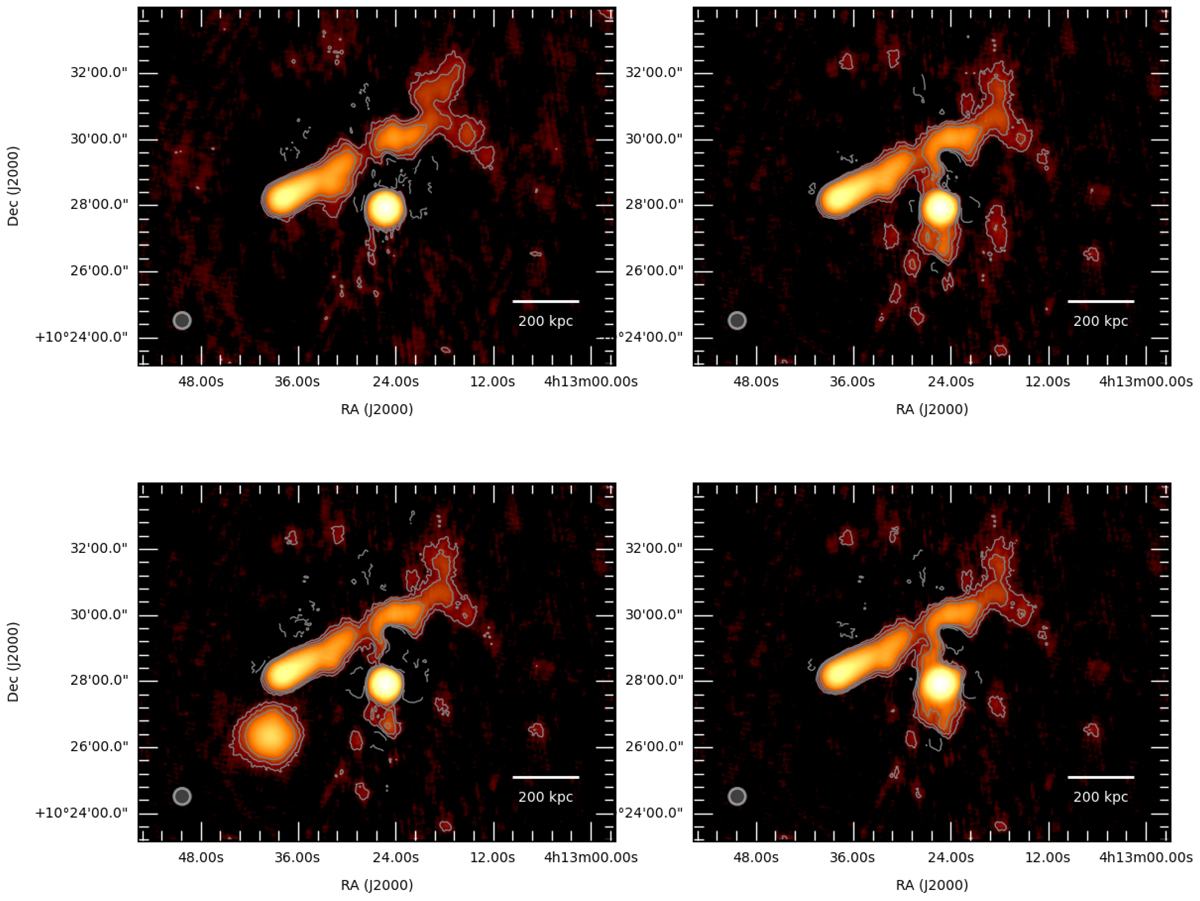
Low-resolution (30′′ × 30′′) LOFAR image of the cluster A478 at 144 MHz. The contour levels are (1, 2, 4) × 3σ, where σ = 620 μJy beam−1. No mock mini halo is injected in the data set in the top left panel. A mock mini halo with I0 = 1 μJy arcsec−2 is injected at the cluster centre with re = 100 kpc in the top right panel. A mock mini halo with I0 = 13 μJy arcsec−2 is injected at the cluster centre with re = 25 kpc at the cluster centre in the bottom right panel, and in a close-by void region in the bottom left panel. The values for re and I0 are chosen accordingly to the top panel of Fig. 7 in Murgia et al. (2009) and are referred to measurements at 1.4 GHz.
Current usage metrics show cumulative count of Article Views (full-text article views including HTML views, PDF and ePub downloads, according to the available data) and Abstracts Views on Vision4Press platform.
Data correspond to usage on the plateform after 2015. The current usage metrics is available 48-96 hours after online publication and is updated daily on week days.
Initial download of the metrics may take a while.