Fig. 15.
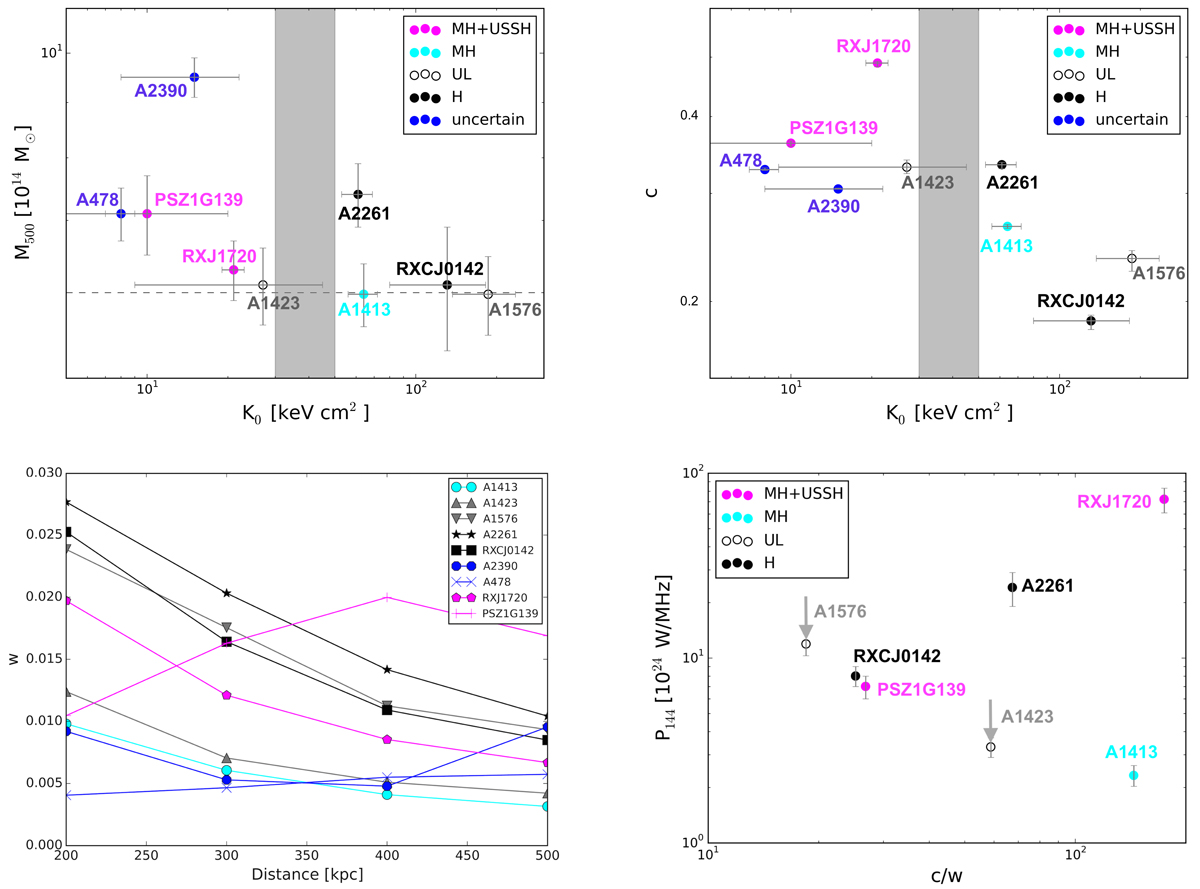
Top left panel: central entropy K0 vs. cluster mass M500 of our selected sample of clusters. The selection in mass (M500 ≥ 6 × 10¹⁴M⊙) is indicated by a dashed line. Clusters with low central entropies (K0 < 30 − 50 keV cm2) are expected to host a cool core, whilst high central entropy (K0 > 50 keV cm2) indicates a non-cool-core cluster (Giacintucci et al. 2017). The sources are coloured according to the new LOFAR findings: clusters with mini haloes and USS haloes (MH+USSH) are indicated by magenta circles, with candidate mini haloes (cMH) by cyan circles and radio haloes (H) by black circles. Clusters with no detected central diffuse radio emission, for which new upper limits (UL) were derived, are denoted by empty circles. Top right panel: central entropy K0 vs. concentration parameter c. High values of c and low values of K0 indicate that the cluster host a cool core. In particular, clusters with low central entropies (K0 < 30 − 50 keV cm2) host a cool core, whilst high central entropy (K0 > 50 keV cm2) indicates a non-cool-core cluster (Giacintucci et al. 2017). The only warm-core cluster hosting a mini halo is A1413. Bottom left panel: emission centroid shift w vs. distance from the cluster centre at which w is computed. The value w was computed at a scale of 200, 300, 400 and 500 kpc. We note that the value of w gets smaller going to outer distances for all the clusters but PSZ1G139.61+24. Bottom right panel: total radio power at 144 MHz of the diffuse emission vs. the ratio between the concentration parameter and emission centroid shift derived at 500 kpc.
Current usage metrics show cumulative count of Article Views (full-text article views including HTML views, PDF and ePub downloads, according to the available data) and Abstracts Views on Vision4Press platform.
Data correspond to usage on the plateform after 2015. The current usage metrics is available 48-96 hours after online publication and is updated daily on week days.
Initial download of the metrics may take a while.