Fig. 14.
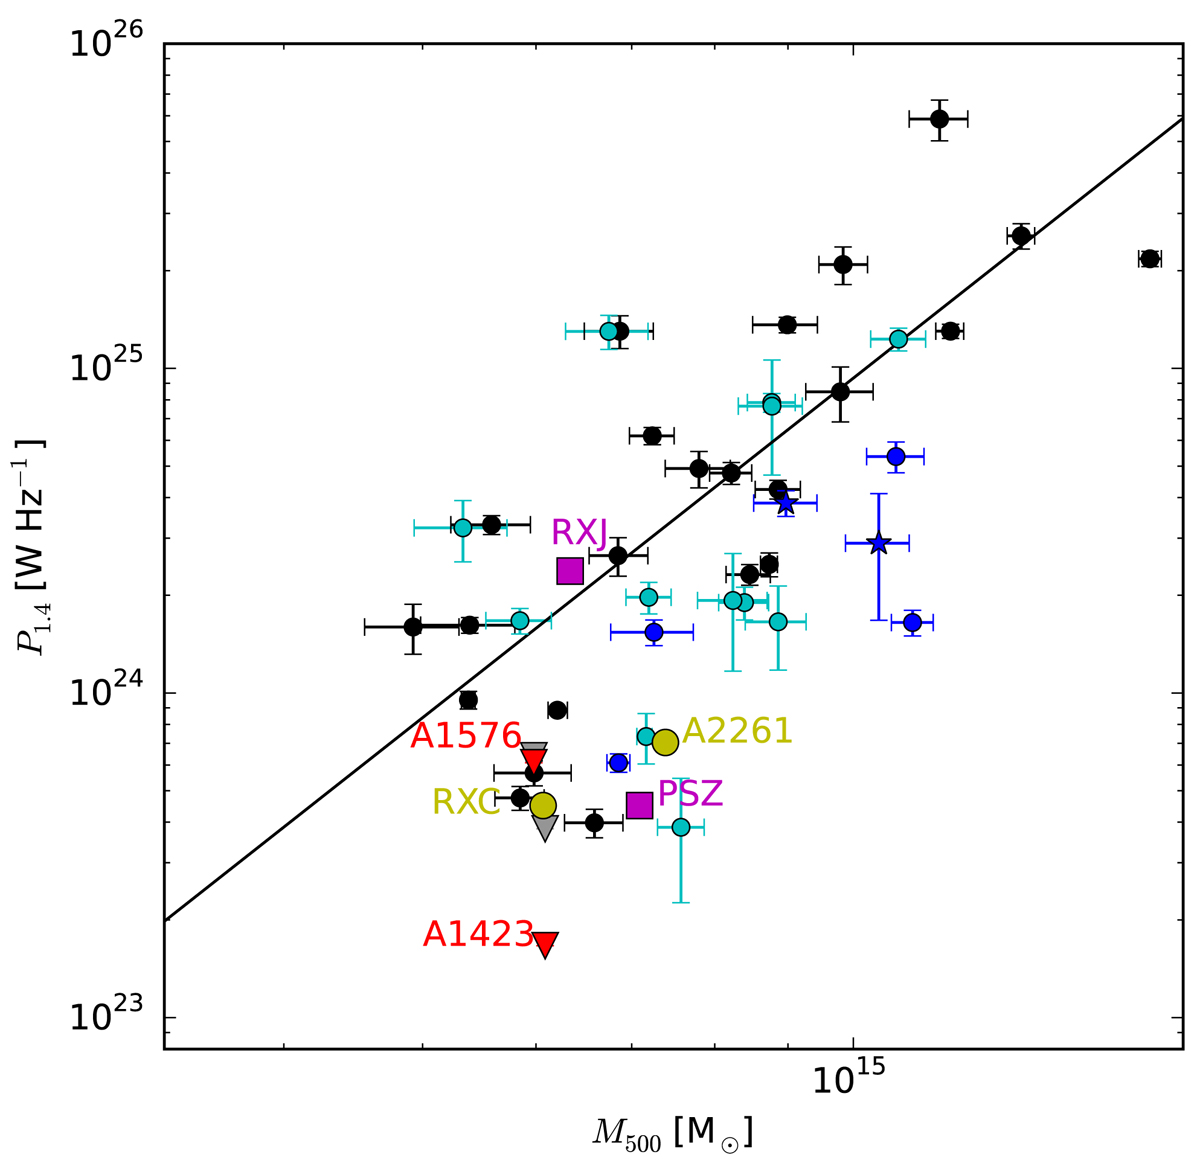
Radio power at 1.4 GHz vs. cluster mass M500 for a sample of clusters with radio halo. The plot is reproduced from Martinez Aviles et al. (2016). Haloes with flux density measured at 1.4 GHz are indicated by black circles and their related fit is shown as a black line. Haloes with flux density measured at frequencies other than 1.4 GHz are indicated by cyan circles, ultra-steep haloes by blue circles, and ultra-steep haloes with flux density measured at frequencies other than 1.4 GHz by blue stars. The upper limit of radio halo power at 1.4 GHz in A1423 and A1576 are indicated by triangles, as derived in the literature in grey and the new limits obtained with LOFAR in red. The limit derived for A1576 is almost coincident with the value in literature, while that for A1423 is almost a factor of 2 smaller. We also indicate the power of the haloes in A2261 and RXCJ0142.0+2131 with yellow circles, and the steep-spectrum sources in PSZ1G139.6+24 and RXJ1720.1+2638 with magenta squares.
Current usage metrics show cumulative count of Article Views (full-text article views including HTML views, PDF and ePub downloads, according to the available data) and Abstracts Views on Vision4Press platform.
Data correspond to usage on the plateform after 2015. The current usage metrics is available 48-96 hours after online publication and is updated daily on week days.
Initial download of the metrics may take a while.