Fig. 13.
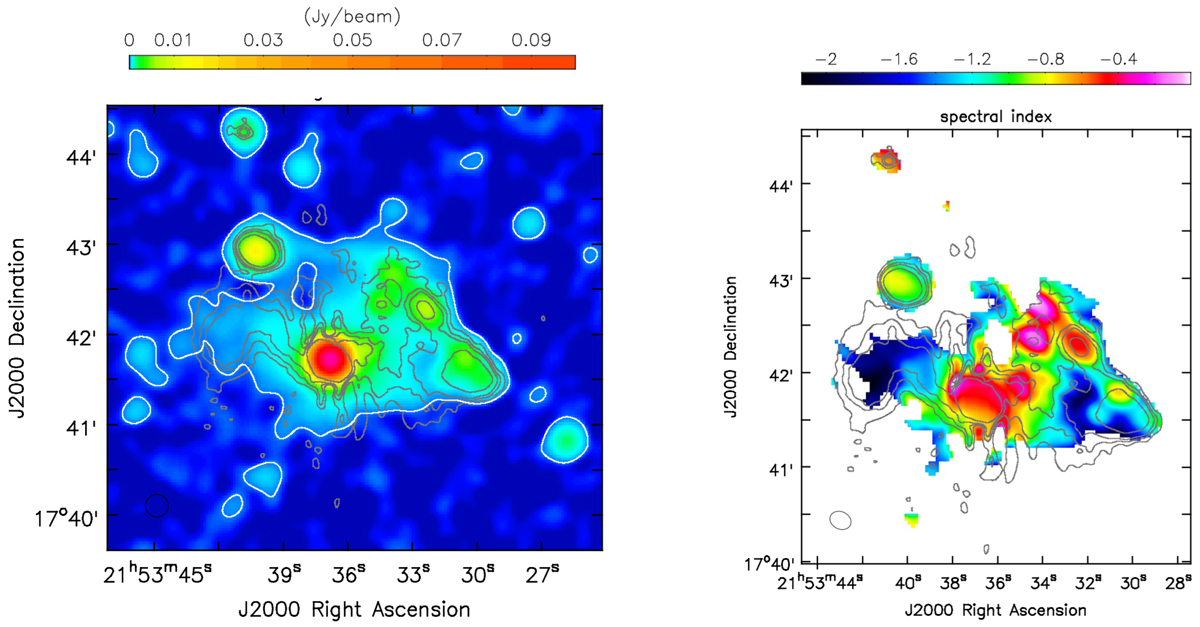
Left panel: 1.5 GHz VLA image of A2390 with a beam of 15′′ × 15′′ and an rms noise of 26 μJy beam−1. The first 3σ contour is shown in white. Right panel: spectral index map between the 1.5 GHz VLA and 144 MHz LOFAR images of A2390. The contour levels, overlaid in grey, are from the LOFAR high-resolution image in Fig. 12 with (4, 8, 12, 24) × σ where σ = 400 μJy beam−1. Pixels below 3σ are blanked. The error map is shown in Fig. A.4.
Current usage metrics show cumulative count of Article Views (full-text article views including HTML views, PDF and ePub downloads, according to the available data) and Abstracts Views on Vision4Press platform.
Data correspond to usage on the plateform after 2015. The current usage metrics is available 48-96 hours after online publication and is updated daily on week days.
Initial download of the metrics may take a while.