Fig. 10.
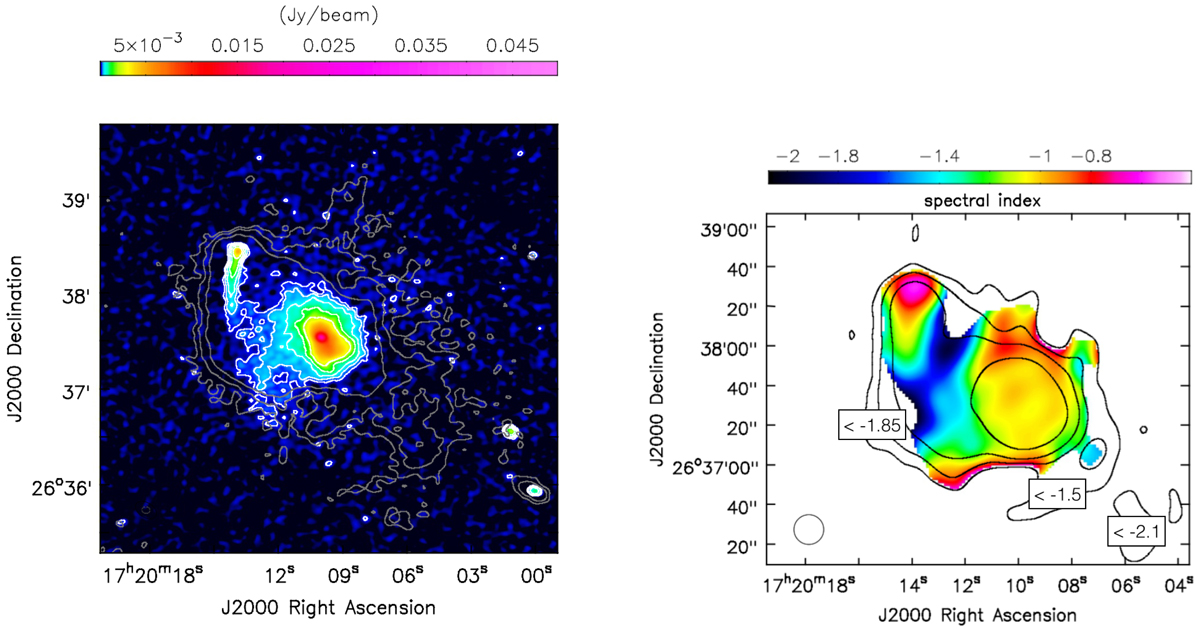
Left panel: 610 MHz GMRT image of RXJ1720.1+2638 with its contour levels in white starting at 3σ, where σ = 45 μJy beam−1 spaced by a factor of two. The first three contour levels from the high-resolution LOFAR image of Fig. 9 are overlaid in grey. The beam are 5′′ × 5′′ and 14′′ × 9′′ for GMRT and LOFAR, respectively, and are shown in the bottom left corner of the image. Right panel: spectral index map between the 610 MHz GMRT and 144 MHz LOFAR images of RXJ1720.1+2638. The contour levels, overlaid in black, are from the LOFAR image obtained for the spectral analysis (uniform weighting, uv-cut, see main text), not shown in the paper. Pixels below 3σ are blanked. The error map is shown in Fig. A.3.
Current usage metrics show cumulative count of Article Views (full-text article views including HTML views, PDF and ePub downloads, according to the available data) and Abstracts Views on Vision4Press platform.
Data correspond to usage on the plateform after 2015. The current usage metrics is available 48-96 hours after online publication and is updated daily on week days.
Initial download of the metrics may take a while.