Fig. 1.
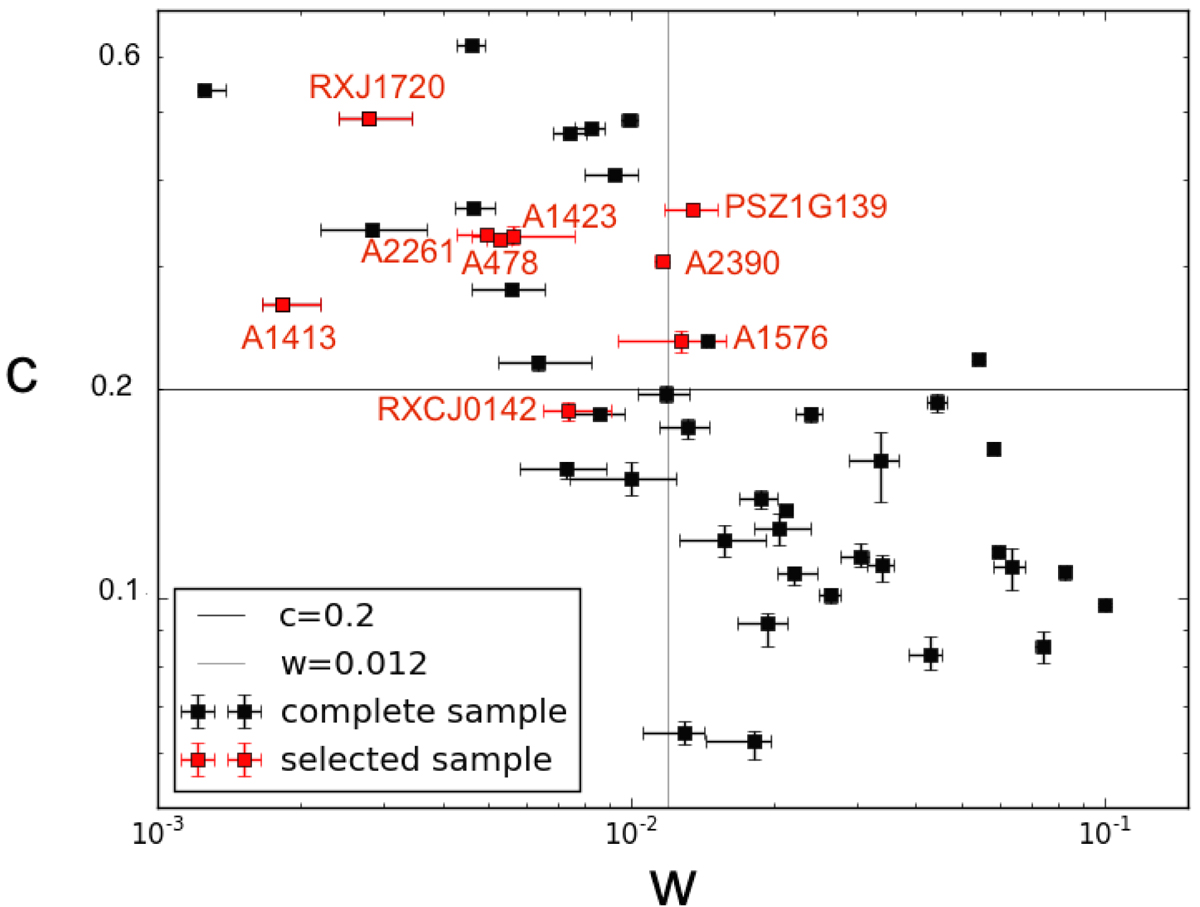
Diagram of the X-ray morphological indicators based on Chandra observations for the galaxy clusters, the emission centroid shift, w, and the concentration parameter, c, of the mass-selected cluster sample in Cuciti et al. (2015) and Cassano et al. (2016). Red squares indicate the sources of our sample. Following Cassano et al. (2010), we adopted the values w ≤ 0.012 and c ≥ 0.2 as an indication of the distinction between merging/non-merging clusters. Merging clusters lie in the bottom right region of the plot, whilst non-merging clusters in the top left region.
Current usage metrics show cumulative count of Article Views (full-text article views including HTML views, PDF and ePub downloads, according to the available data) and Abstracts Views on Vision4Press platform.
Data correspond to usage on the plateform after 2015. The current usage metrics is available 48-96 hours after online publication and is updated daily on week days.
Initial download of the metrics may take a while.