Fig. 7.
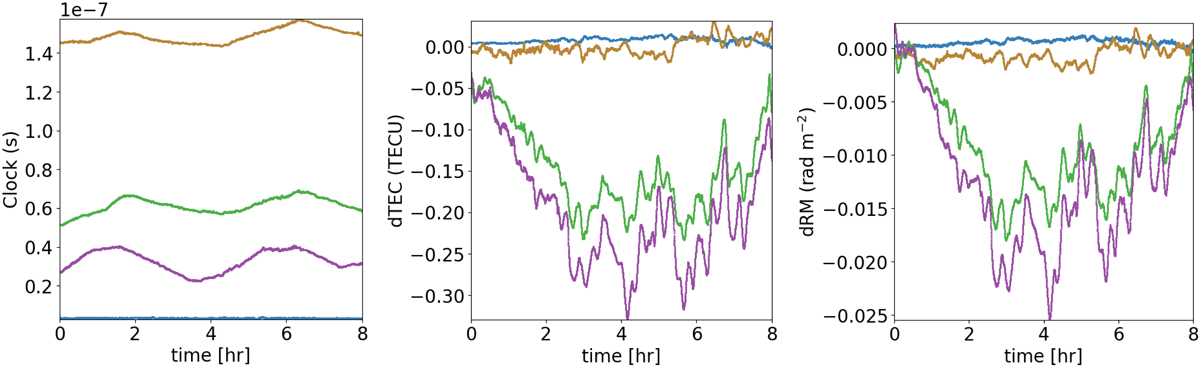
Ionospheric systematic effects affecting phases for the same four stations of Fig. 5. From top to bottom in the first panel: RS106 (brown), RS508 (green), RS509 (purple), and CS302 (blue). From left to right: clock delays, first order ionospheric delay, and Faraday rotation. The CS has uniformly zero clock delays as its clock is the same as the reference station (CS002). RS508 and RS509 TEC values track each other as the two stations are relatively close by. The TEC unit (TECU) is defined as 1016 m−2, which is the order of magnitude typically observed at zenith during the night. The clear correlation between dTEC and dRM (second and third panel) is because differential Faraday rotation is to a large extent caused by the difference in integrated TEC multiplied with the parallel magnetic field. The HBA equivalent is shown in Fig. A.5.
Current usage metrics show cumulative count of Article Views (full-text article views including HTML views, PDF and ePub downloads, according to the available data) and Abstracts Views on Vision4Press platform.
Data correspond to usage on the plateform after 2015. The current usage metrics is available 48-96 hours after online publication and is updated daily on week days.
Initial download of the metrics may take a while.