Fig. 6.
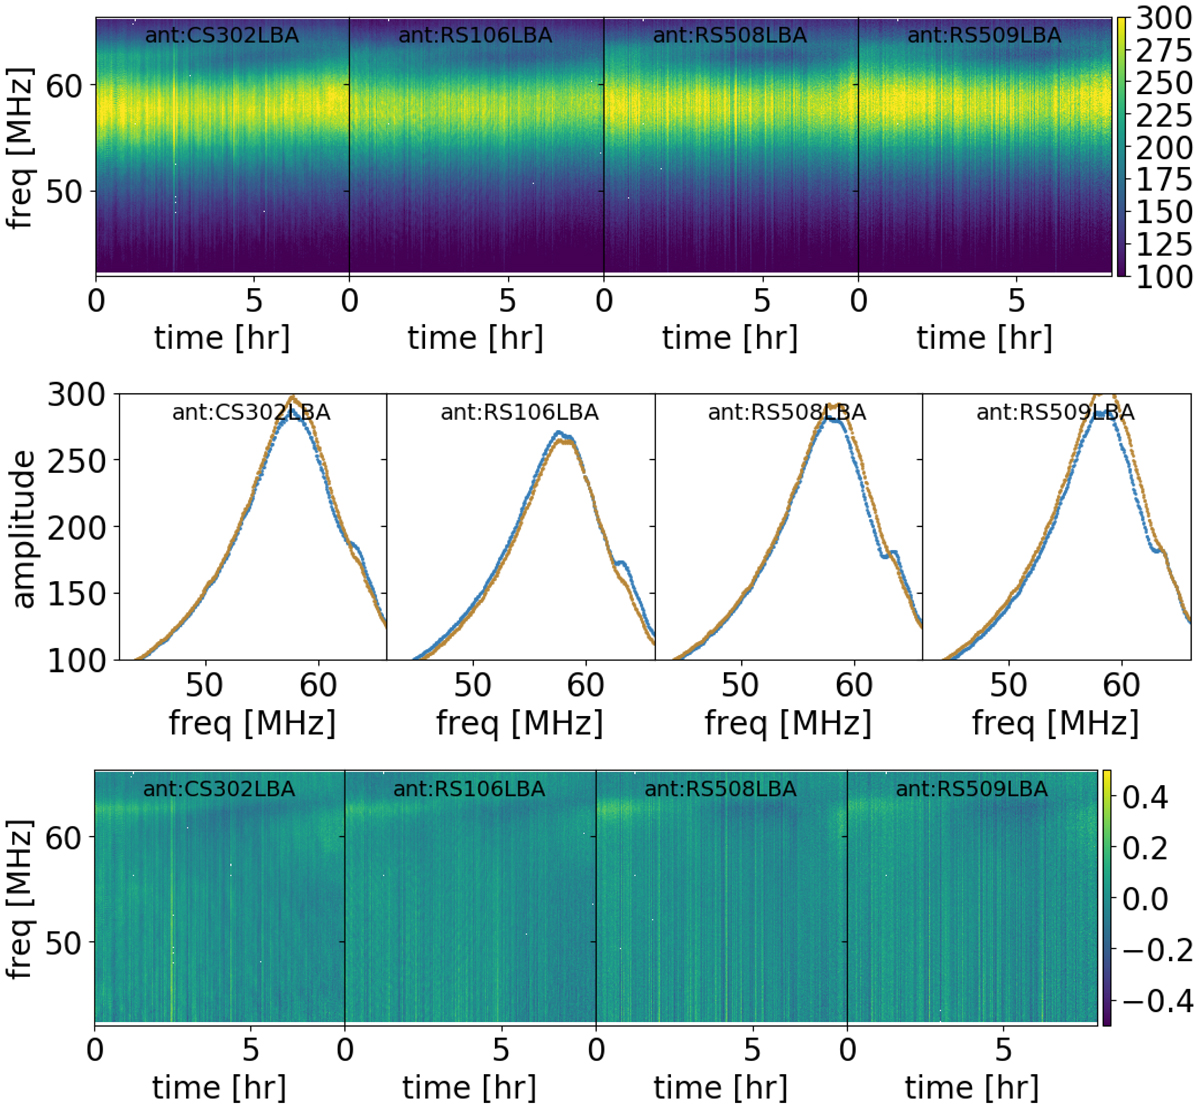
Same as Fig. 3. Top panel: amplitude solutions for the XX element of the diagonal matrix. Mid-panel: time median of the amplitude solutions; this represents the instrument bandpass. Blue is for the XX polarisation and brown for the YY. Bottom panel: residuals after dividing the top panel by the time-independent bandpass. The HBA equivalent is shown in Fig. A.4.
Current usage metrics show cumulative count of Article Views (full-text article views including HTML views, PDF and ePub downloads, according to the available data) and Abstracts Views on Vision4Press platform.
Data correspond to usage on the plateform after 2015. The current usage metrics is available 48-96 hours after online publication and is updated daily on week days.
Initial download of the metrics may take a while.