Fig. 3.
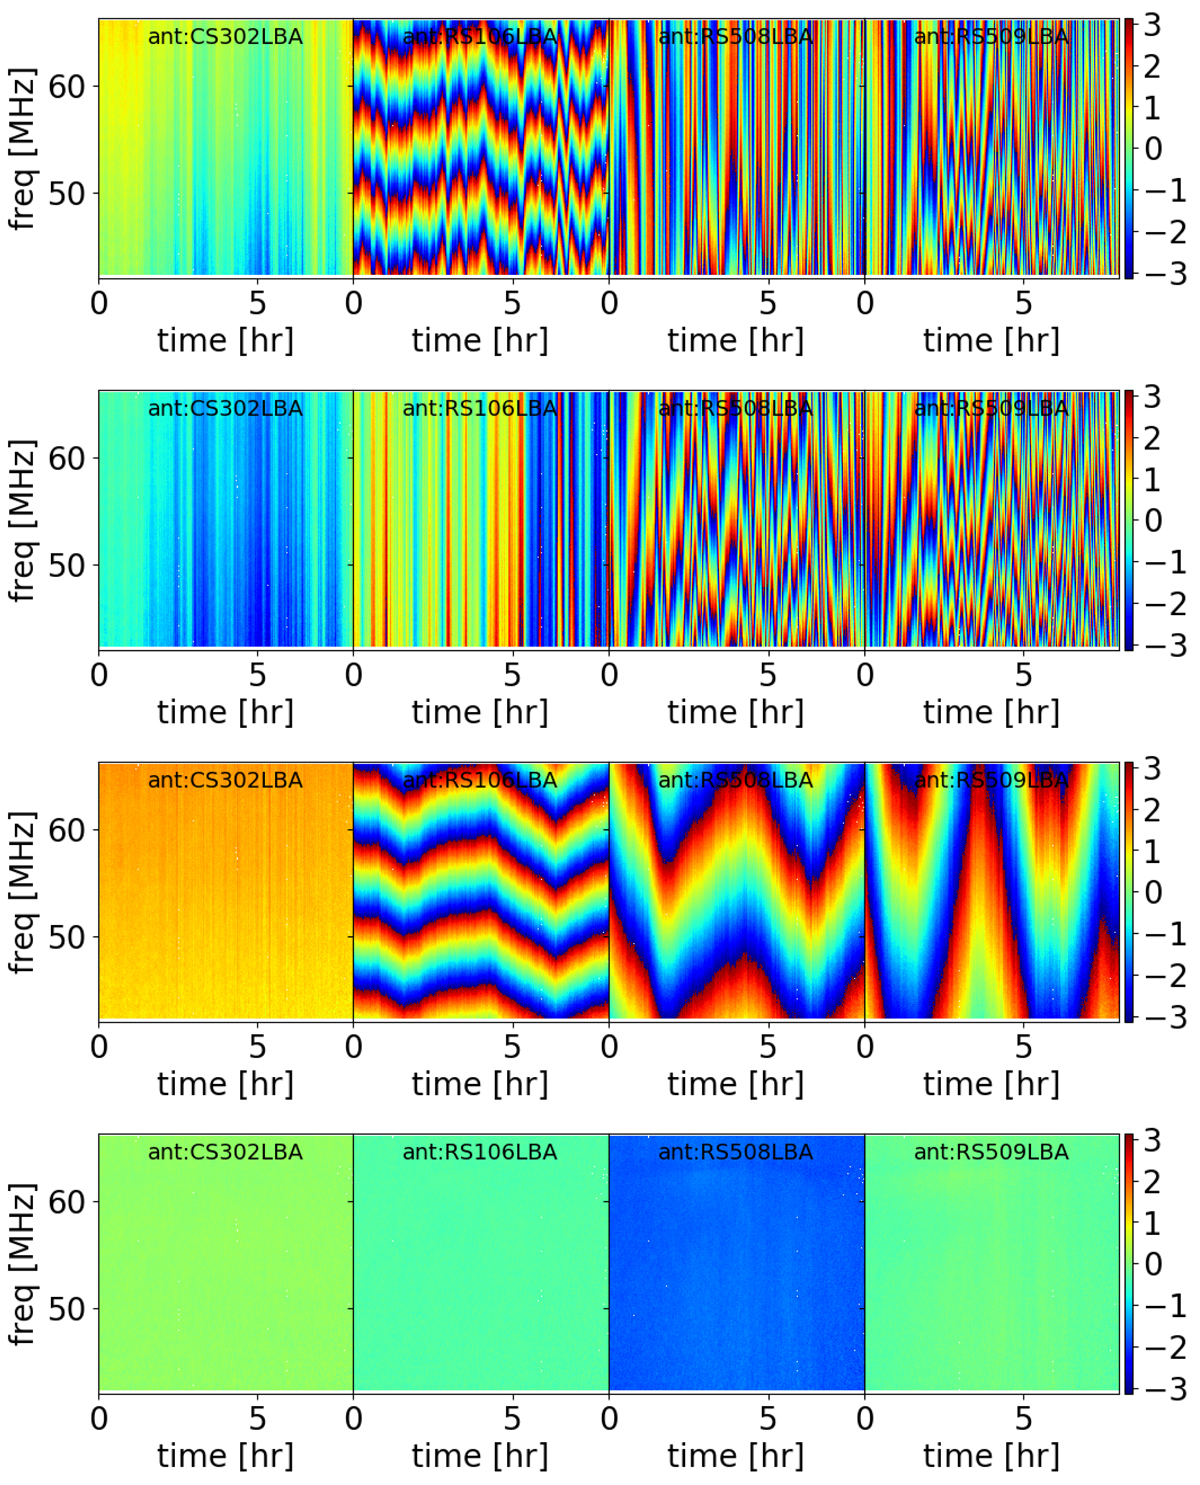
Phase solutions in radians for four different stations (CS302, RS106, RS508, and RS509) plotted as a function of observing time (x-axis) and frequency (y-axis). Colour goes from −π (blue) to +π (red). All phases are referenced to station CS002, at the array centre. First panel: phase solutions for the XX element of a diagonal Jones matrix obtained at the beginning of the calibration. Those solutions encode all the systematic effects affecting LOFAR LBA phases. Second panel: same as above but after the subtraction of the clock systematic effect, only the ionosphere is visible. Third panel: same as the first panel, but after the subtraction of the ionospheric systematic effect, only the clock is visible (CS302 has the same clock of the reference). Bottom panel: same as above but solving after the subtraction of all recovered systematic effects, i.e. at the end of the calibration pipeline. The uniformity of the plots shows we are able to remove systematic effects with high accuracy. The HBA equivalent is shown in Fig. A.1.
Current usage metrics show cumulative count of Article Views (full-text article views including HTML views, PDF and ePub downloads, according to the available data) and Abstracts Views on Vision4Press platform.
Data correspond to usage on the plateform after 2015. The current usage metrics is available 48-96 hours after online publication and is updated daily on week days.
Initial download of the metrics may take a while.