Free Access
Fig. 10.
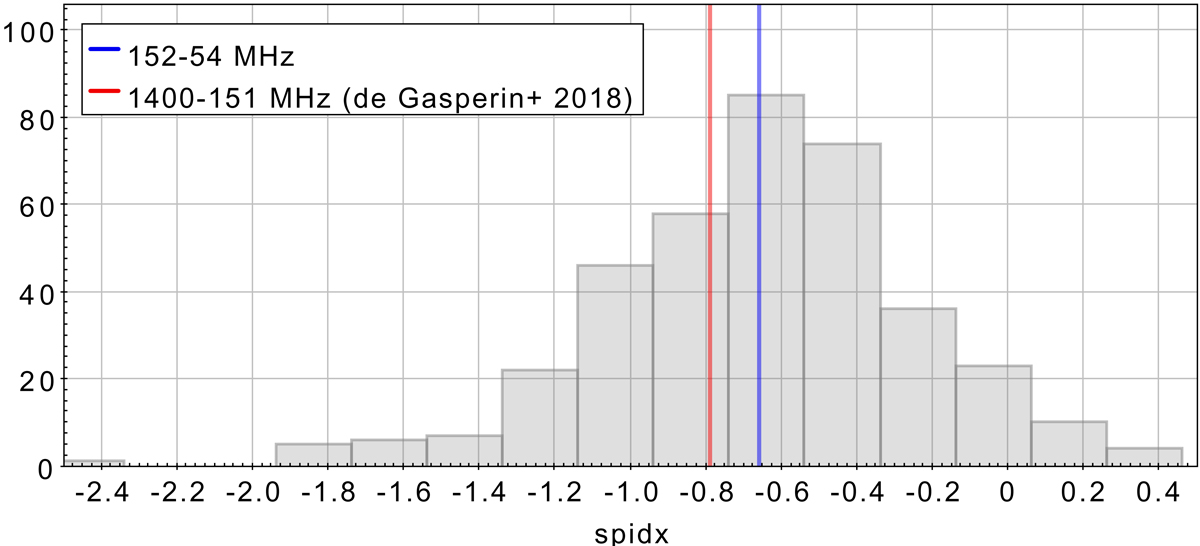
Spectral index distribution of the 520 matched sources from Figs. 8 and 9. The mean of the distribution is ![]() and the median is
and the median is ![]() . The mean spectral index found cross-matching half a million sources from TGSS (151 MHz) and NVSS (1400 MHz) surveys is also shown (
. The mean spectral index found cross-matching half a million sources from TGSS (151 MHz) and NVSS (1400 MHz) surveys is also shown (![]() ; de Gasperin et al. 2018a).
; de Gasperin et al. 2018a).
Current usage metrics show cumulative count of Article Views (full-text article views including HTML views, PDF and ePub downloads, according to the available data) and Abstracts Views on Vision4Press platform.
Data correspond to usage on the plateform after 2015. The current usage metrics is available 48-96 hours after online publication and is updated daily on week days.
Initial download of the metrics may take a while.