Fig. 1.
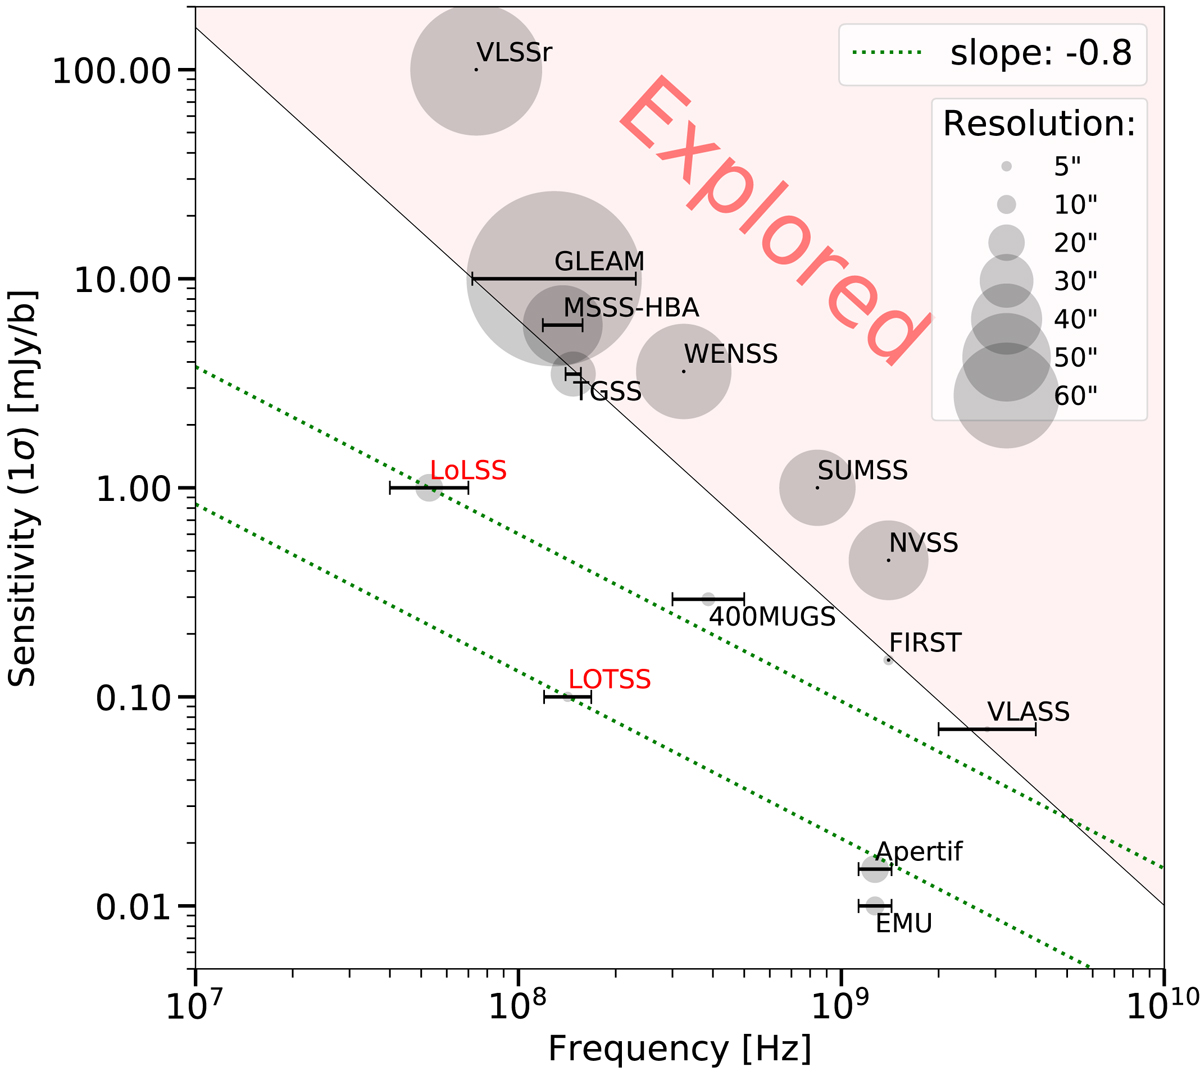
Sensitivity comparison among a number of current, ongoing, and planned large-area radio surveys. The diameters of grey circles are proportional to the survey beam size as shown in the upper right corner. For wide band surveys we show the frequency coverage using horizontal lines. References: GLEAM (GaLactic and Extragalactic All-sky Murchison Widefield Array survey; Hurley-Walker et al. 2017); MSSS-HBA (LOFAR Multi-frequency Snapshot Sky Survey; Heald et al. 2015); TGSS ADR1 (TIFR GMRT Sky Survey - Alternative Data Release 1; Intema et al. 2017); VLSSr (VLA Low-frequency Sky Survey redux; Lane et al. 2014); FIRST (Faint Images of the Radio Sky at Twenty Centimetres; Becker et al. 1995); NVSS (1.4 GHz NRAO VLA Sky Survey; Condon et al. 1998); WENSS (The Westerbork Northern Sky Survey; Rengelink & Tang 1997); SUMSS (Sydney University Molonglo Sky Survey; Bock et al. 1999); 400MUGS (400 MHz Upgraded GMRT Survey; de Gasperin et al., in prep.); EMU (Evolutionary Map of the Universe; Norris et al. 2011); Apertif (Rottgering et al. 2011); VLASS (VLA Sky Survey; Lacy et al., in prep.); LOTSS (LOFAR Two-metre Sky Survey; Shimwell et al. 2016); LoLSS (LOFAR LBA Sky Survey; de Gasperin et al., in prep.)
Current usage metrics show cumulative count of Article Views (full-text article views including HTML views, PDF and ePub downloads, according to the available data) and Abstracts Views on Vision4Press platform.
Data correspond to usage on the plateform after 2015. The current usage metrics is available 48-96 hours after online publication and is updated daily on week days.
Initial download of the metrics may take a while.