Free Access
Fig. 9.
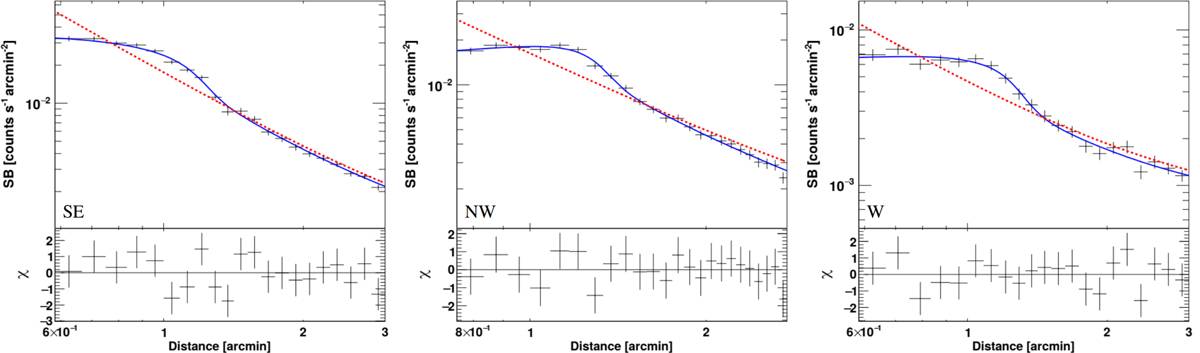
XMM-Newton surface brightness profiles in the 0.5 − 2.0 keV energy band extracted in the white sectors of Fig. 8. The best-fitting broken power laws with residuals and single power laws are reported in solid blue and dashed red, respectively. The residuals at the bottom of the plots refer to the broken power-law fits.
Current usage metrics show cumulative count of Article Views (full-text article views including HTML views, PDF and ePub downloads, according to the available data) and Abstracts Views on Vision4Press platform.
Data correspond to usage on the plateform after 2015. The current usage metrics is available 48-96 hours after online publication and is updated daily on week days.
Initial download of the metrics may take a while.