Free Access
Fig. 6.
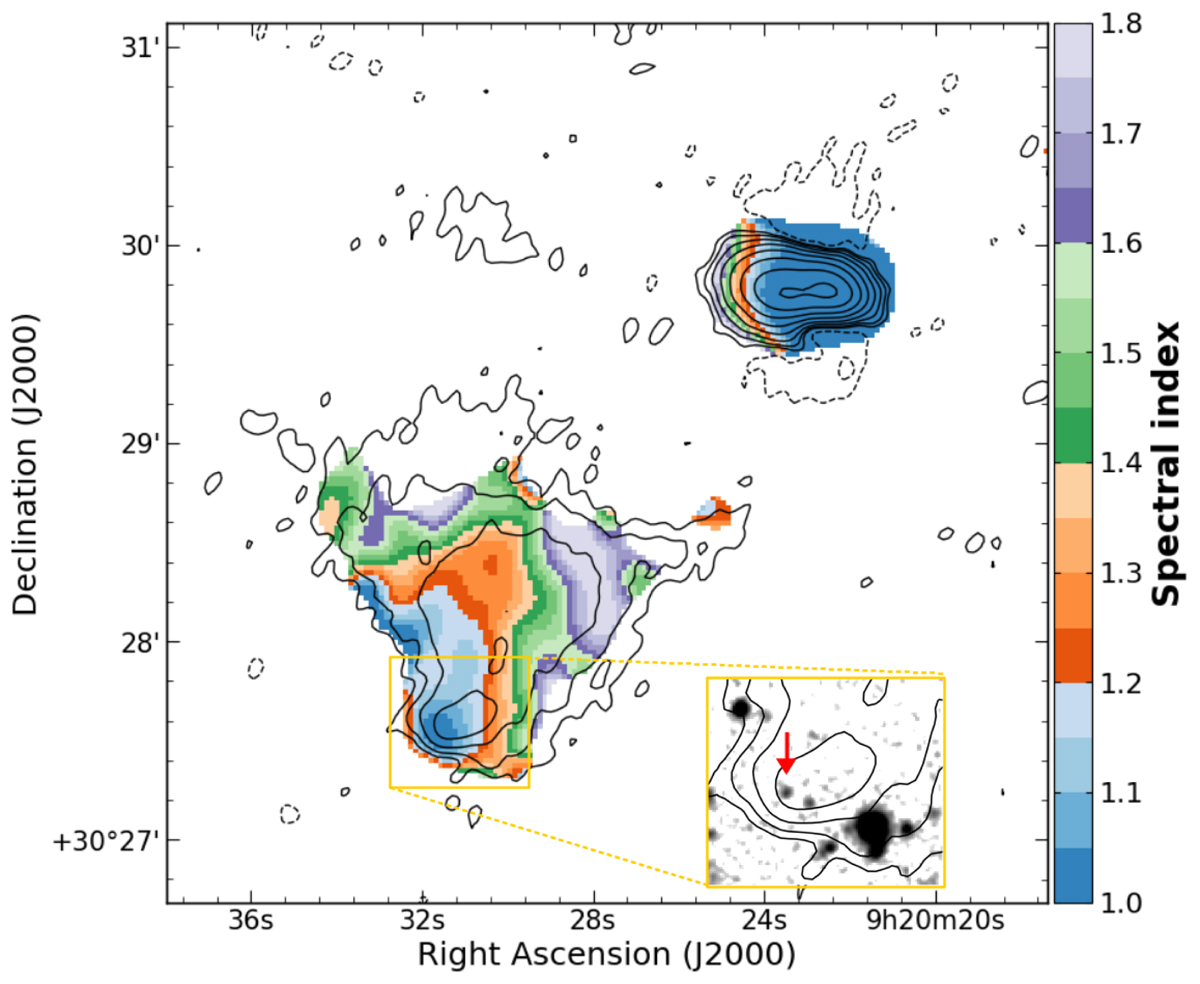
Spectral index map of the peripheral emission between 143 MHz and 610 MHz at a resolution of 15′′ × 15′′ overlaid on the LOFAR contours of Fig. 4. Pixels with values below 3σ were blank. The corresponding error map is reported in Fig. A.1. The inset panel shows an SDSS image with two candidate optical counterparts.
Current usage metrics show cumulative count of Article Views (full-text article views including HTML views, PDF and ePub downloads, according to the available data) and Abstracts Views on Vision4Press platform.
Data correspond to usage on the plateform after 2015. The current usage metrics is available 48-96 hours after online publication and is updated daily on week days.
Initial download of the metrics may take a while.