Fig. 4.
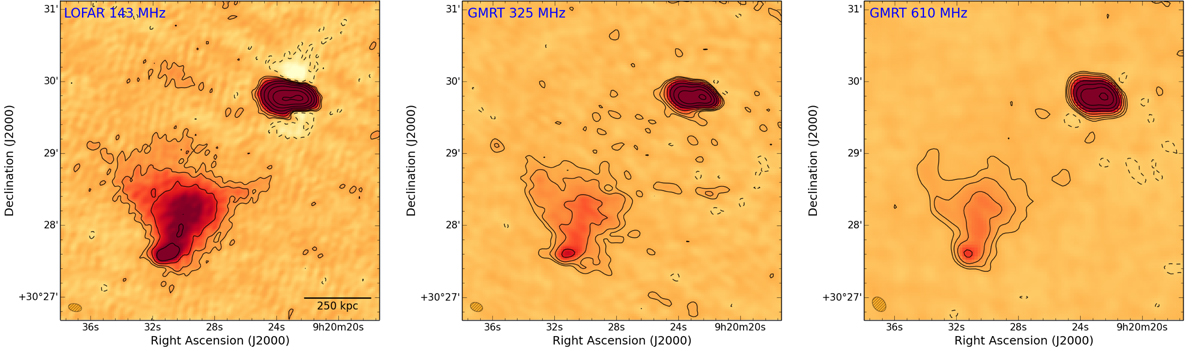
Peripheral emission in A781 (blue region of Fig. 2) as observed in the radio band with LOFAR at 143 MHz (left panel) and with the GMRT at 325 MHz (centre panel) and 610 MHz (right panel). Contours are spaced by a factor of 2 starting from 3σ, where σ143 = 270 μJy beam−1, σ325 = 150 μJy beam−1, and σ610 = 120 μJy beam−1. The negative −3σ contours are shown in dashed. The beam sizes are 11.1′′ × 6.5′′ (143 MHz), 10.6′′ × 7.2′′ (325 MHz) and 13.5′′ × 9.8′′ (610 MHz) and are shown in the bottom left corners.
Current usage metrics show cumulative count of Article Views (full-text article views including HTML views, PDF and ePub downloads, according to the available data) and Abstracts Views on Vision4Press platform.
Data correspond to usage on the plateform after 2015. The current usage metrics is available 48-96 hours after online publication and is updated daily on week days.
Initial download of the metrics may take a while.