Free Access
Fig. 3.
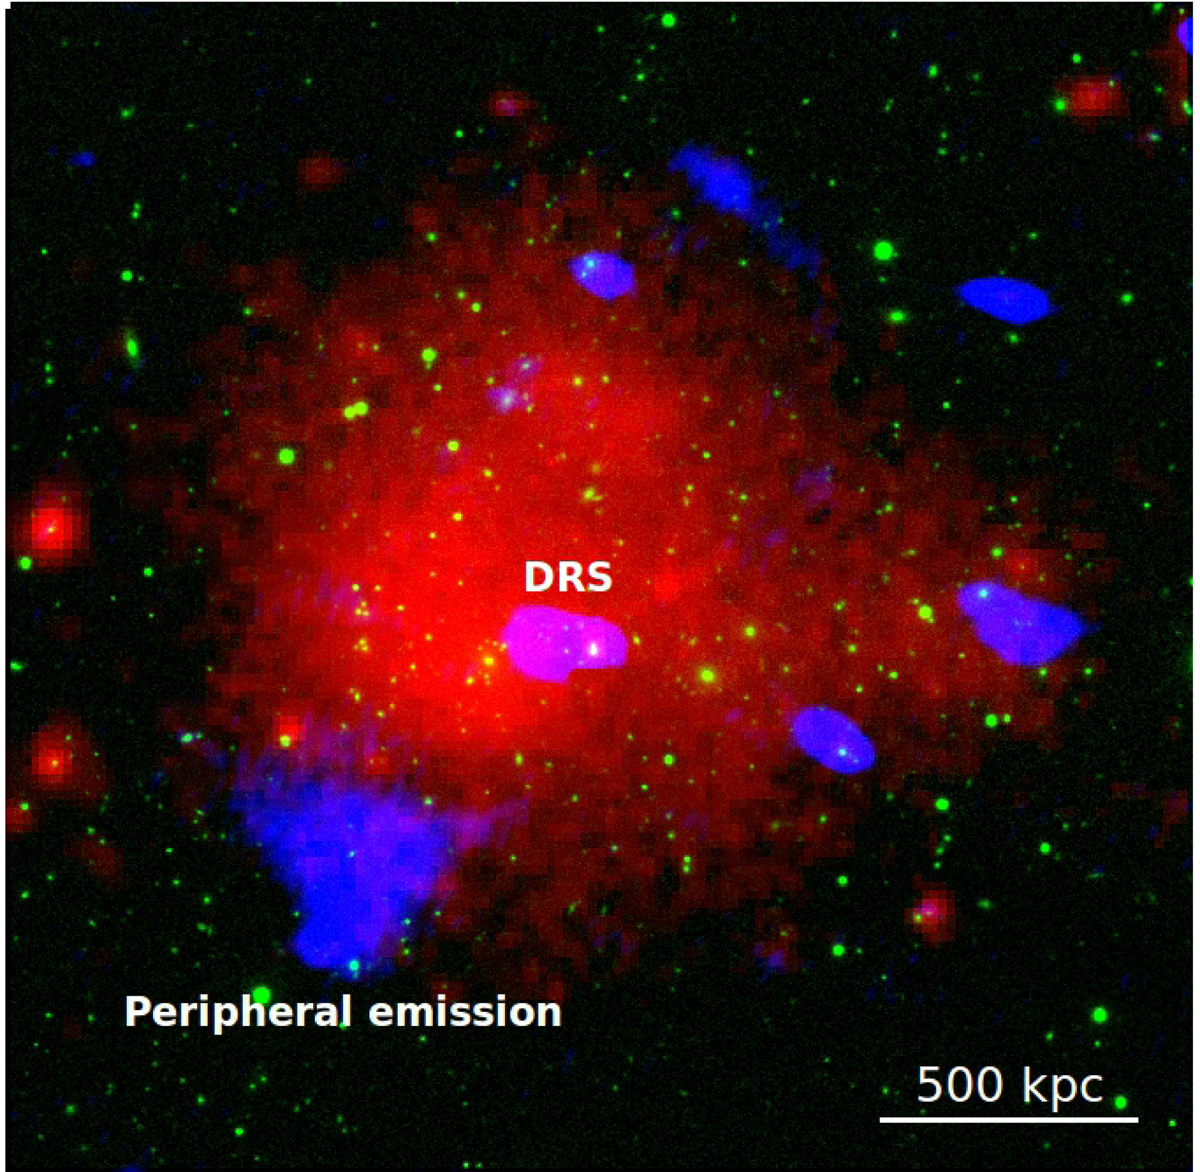
Composite multiwavelength image of A781 (red region of Fig. 2). Optical SDSS g,r,i mosaic is shown in green. Radio emission at 143 MHz from LOFAR is shown in blue. X-ray XMM-Newton emission is shown in red.
Current usage metrics show cumulative count of Article Views (full-text article views including HTML views, PDF and ePub downloads, according to the available data) and Abstracts Views on Vision4Press platform.
Data correspond to usage on the plateform after 2015. The current usage metrics is available 48-96 hours after online publication and is updated daily on week days.
Initial download of the metrics may take a while.