Fig. 2.
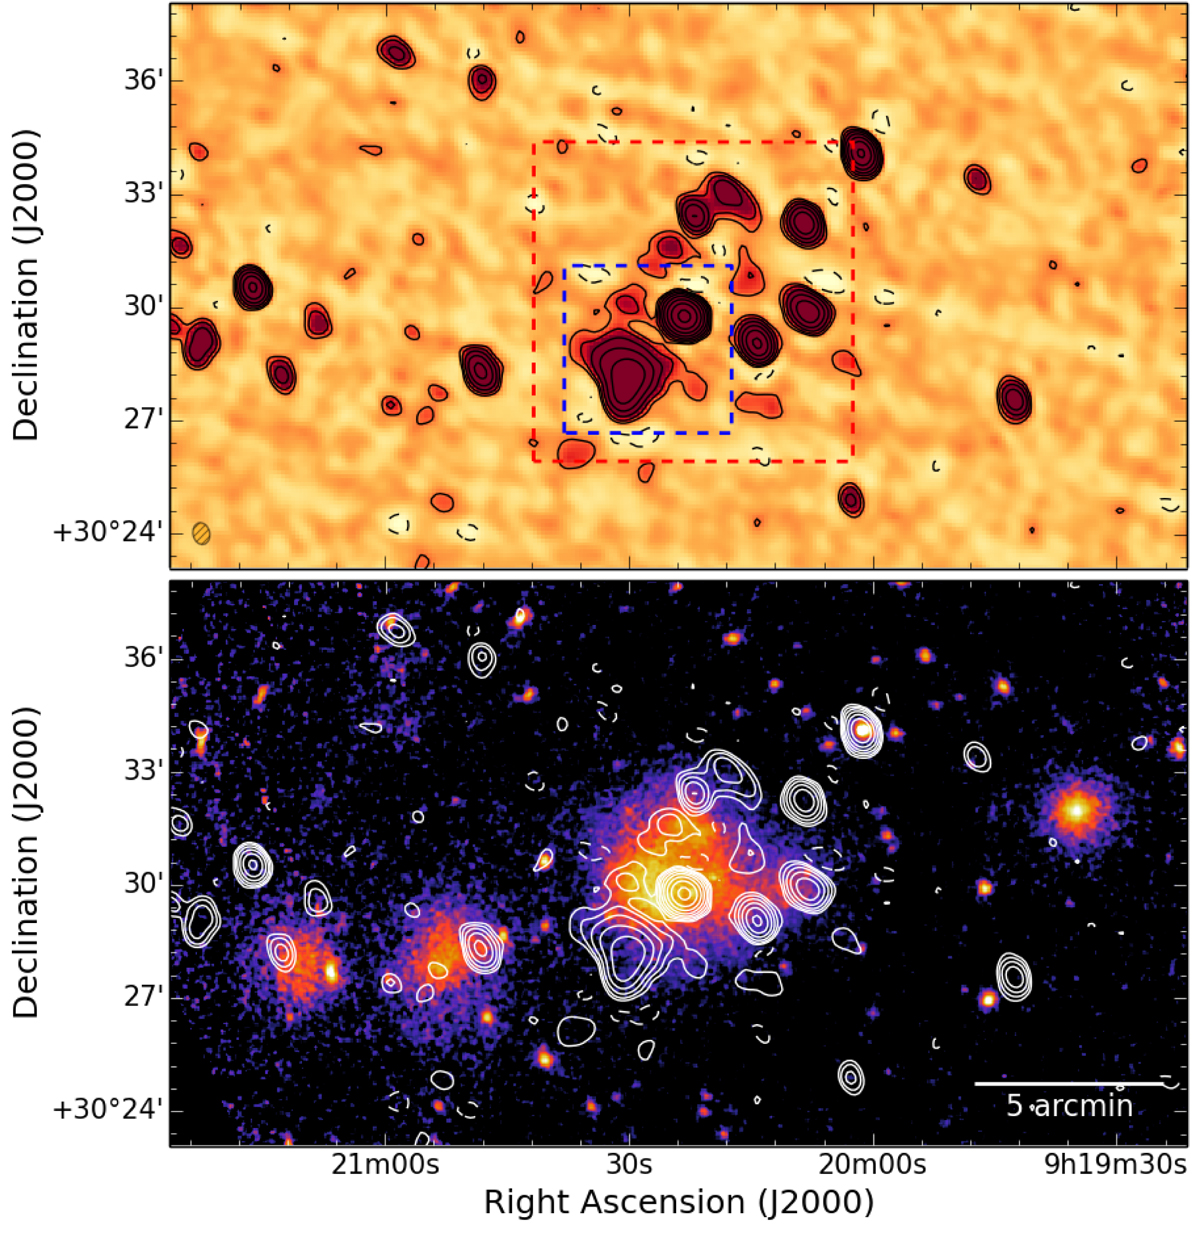
Top panel: LOFAR 143 MHz image at a resolution of 34.9′′ × 26.6′′ (the beam is shown in the bottom left corner). Contours are spaced by a factor of 2 starting from 3σ, where σ = 650 μJy beam−1. The negative −3σ contours are shown in dashed lines. Dashed boxes denote the FOV of the other images reported along the paper. Bottom panel: XMM-Newton smoothed image with the LOFAR contours overlaid.
Current usage metrics show cumulative count of Article Views (full-text article views including HTML views, PDF and ePub downloads, according to the available data) and Abstracts Views on Vision4Press platform.
Data correspond to usage on the plateform after 2015. The current usage metrics is available 48-96 hours after online publication and is updated daily on week days.
Initial download of the metrics may take a while.