Free Access
Fig. 12.
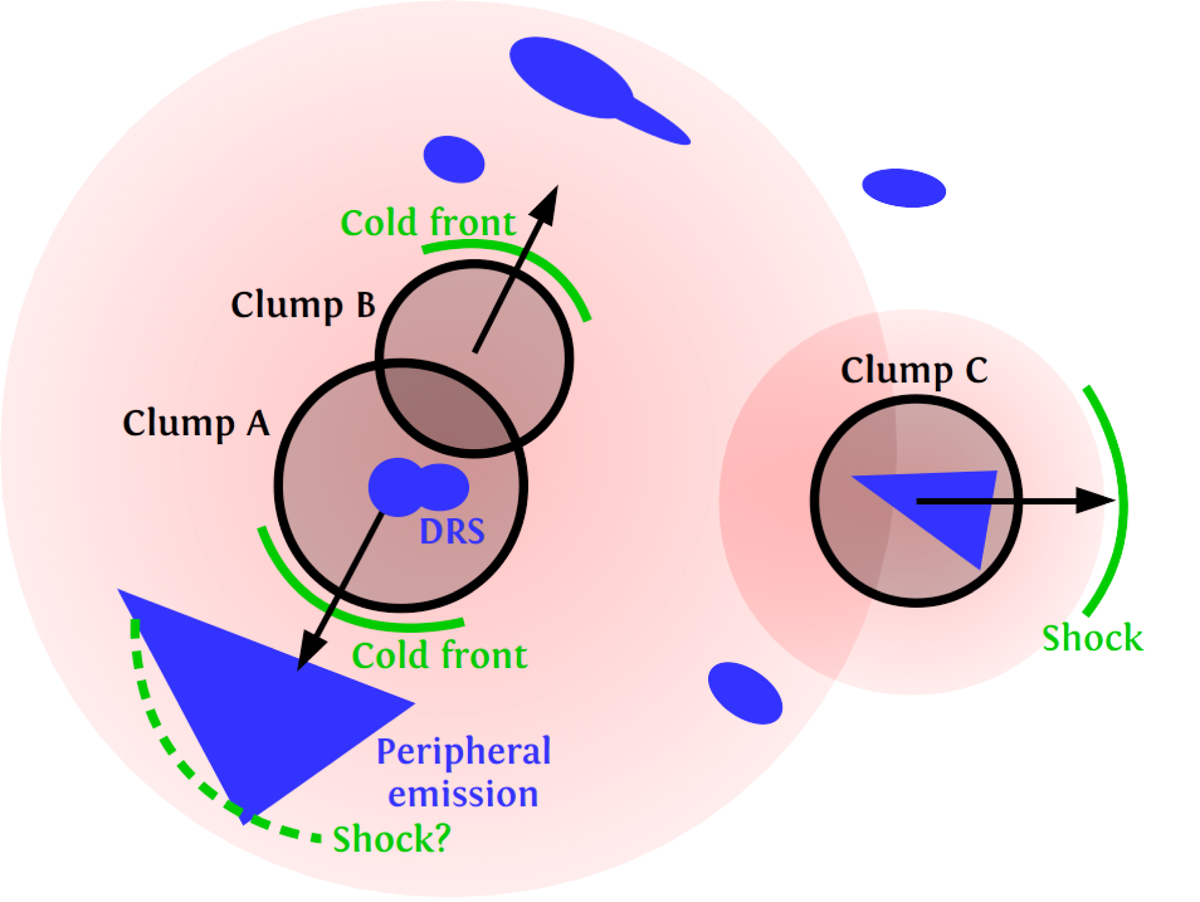
Dynamics of the merger in A781 as suggested from the X-ray data; the diffuse radio sources are sketched in blue while the thermal ICM emission is reported in red (cf. Fig. 3).
Current usage metrics show cumulative count of Article Views (full-text article views including HTML views, PDF and ePub downloads, according to the available data) and Abstracts Views on Vision4Press platform.
Data correspond to usage on the plateform after 2015. The current usage metrics is available 48-96 hours after online publication and is updated daily on week days.
Initial download of the metrics may take a while.