Free Access
Fig. 14
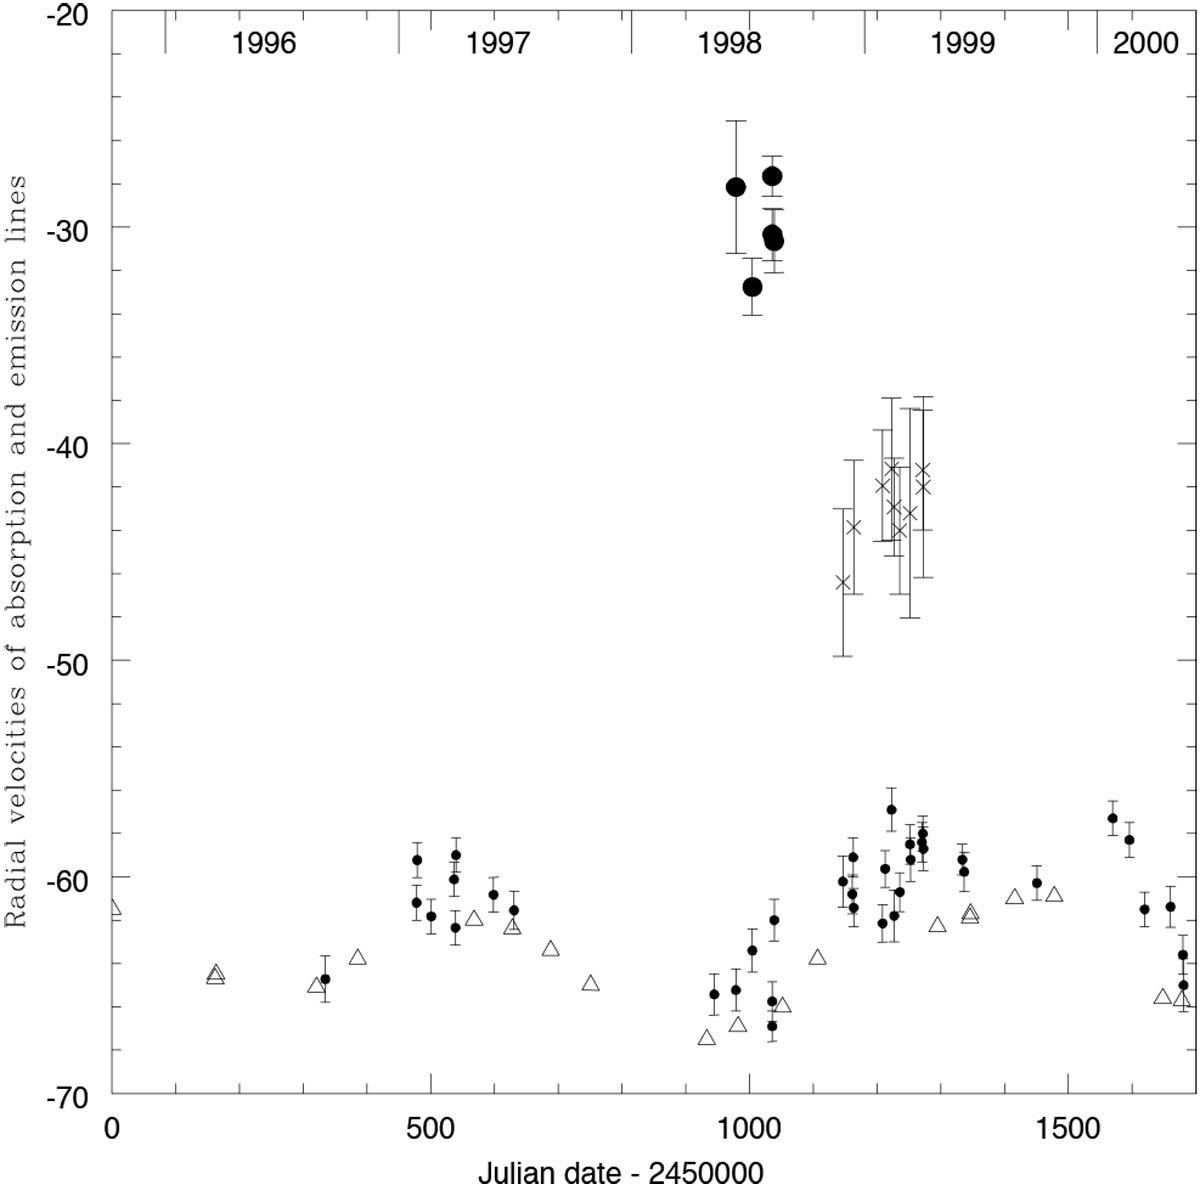
Radial velocities in km s−1 of absorption and emission lines, where dots are the radial velocities of the absorption lines of the M-type giant, solid circles are AVab, crosses are AVab in emission, and triangles are infrared absorption lines measured by Hinkle et al. (2009).
Current usage metrics show cumulative count of Article Views (full-text article views including HTML views, PDF and ePub downloads, according to the available data) and Abstracts Views on Vision4Press platform.
Data correspond to usage on the plateform after 2015. The current usage metrics is available 48-96 hours after online publication and is updated daily on week days.
Initial download of the metrics may take a while.