Fig. 9
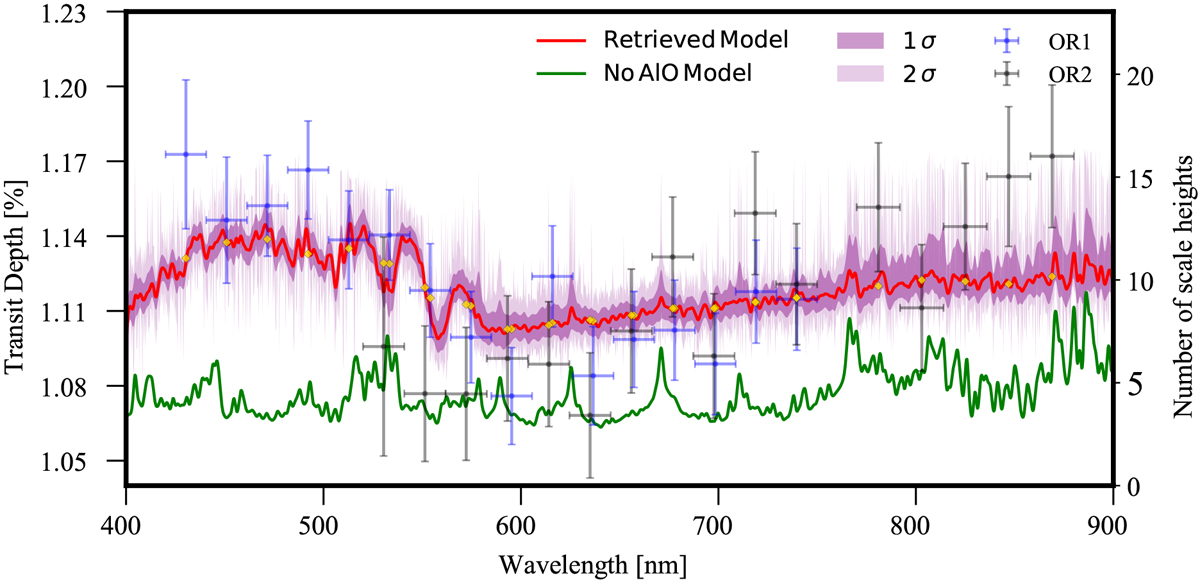
Transmission spectrum of WASP-33 b and retrieved models. The blue and black circles represent transit depths from OR1 and OR2, respectively. Horizontal lines indicate the size of the wavelength bin. Error bars are at the 1-σ level. The red curve shows the retrieved median model and the 1-σ and 2-σ confidence envelopes are shown by the shaded regions. The gold diamonds show the binned median model at the same resolution as the data. The spectrum shows a feature from ~450 to 550 nm that is explained by the model spectrum including AlO.
Current usage metrics show cumulative count of Article Views (full-text article views including HTML views, PDF and ePub downloads, according to the available data) and Abstracts Views on Vision4Press platform.
Data correspond to usage on the plateform after 2015. The current usage metrics is available 48-96 hours after online publication and is updated daily on week days.
Initial download of the metrics may take a while.