Fig. 8
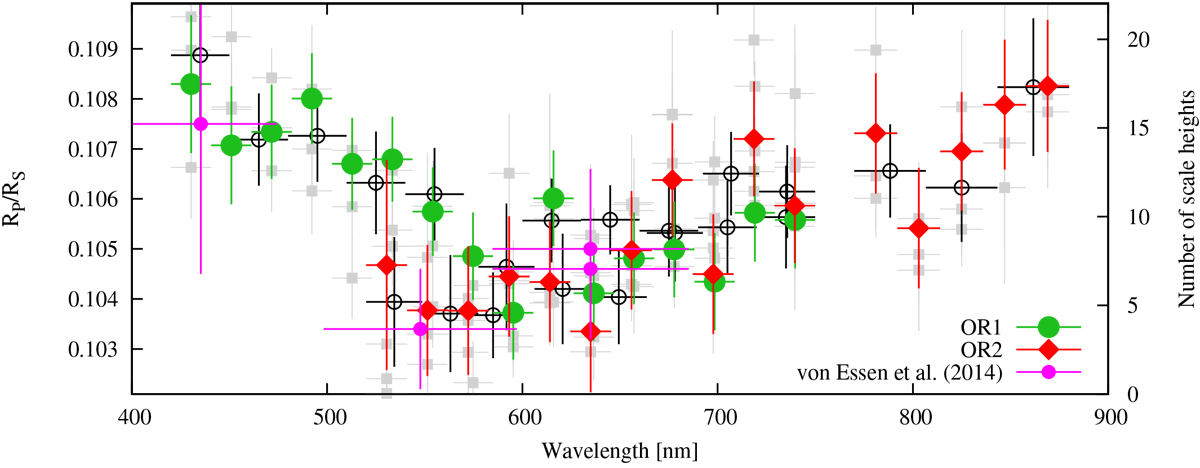
Transmission spectrum of WASP-33 b. Green circles and red diamonds correspond to the planet-to-star radius ratio obtained from OR1 and OR2, respectively. Gray light squares are derived fitting different detrending components to the data. Pink filled circles are from von Essen et al. (2014), and open black circles are considering larger integration bins. In all cases, error bars are at 1-σ level and horizontal lines indicate the size of the wavelength bin.
Current usage metrics show cumulative count of Article Views (full-text article views including HTML views, PDF and ePub downloads, according to the available data) and Abstracts Views on Vision4Press platform.
Data correspond to usage on the plateform after 2015. The current usage metrics is available 48-96 hours after online publication and is updated daily on week days.
Initial download of the metrics may take a while.