Fig. 3
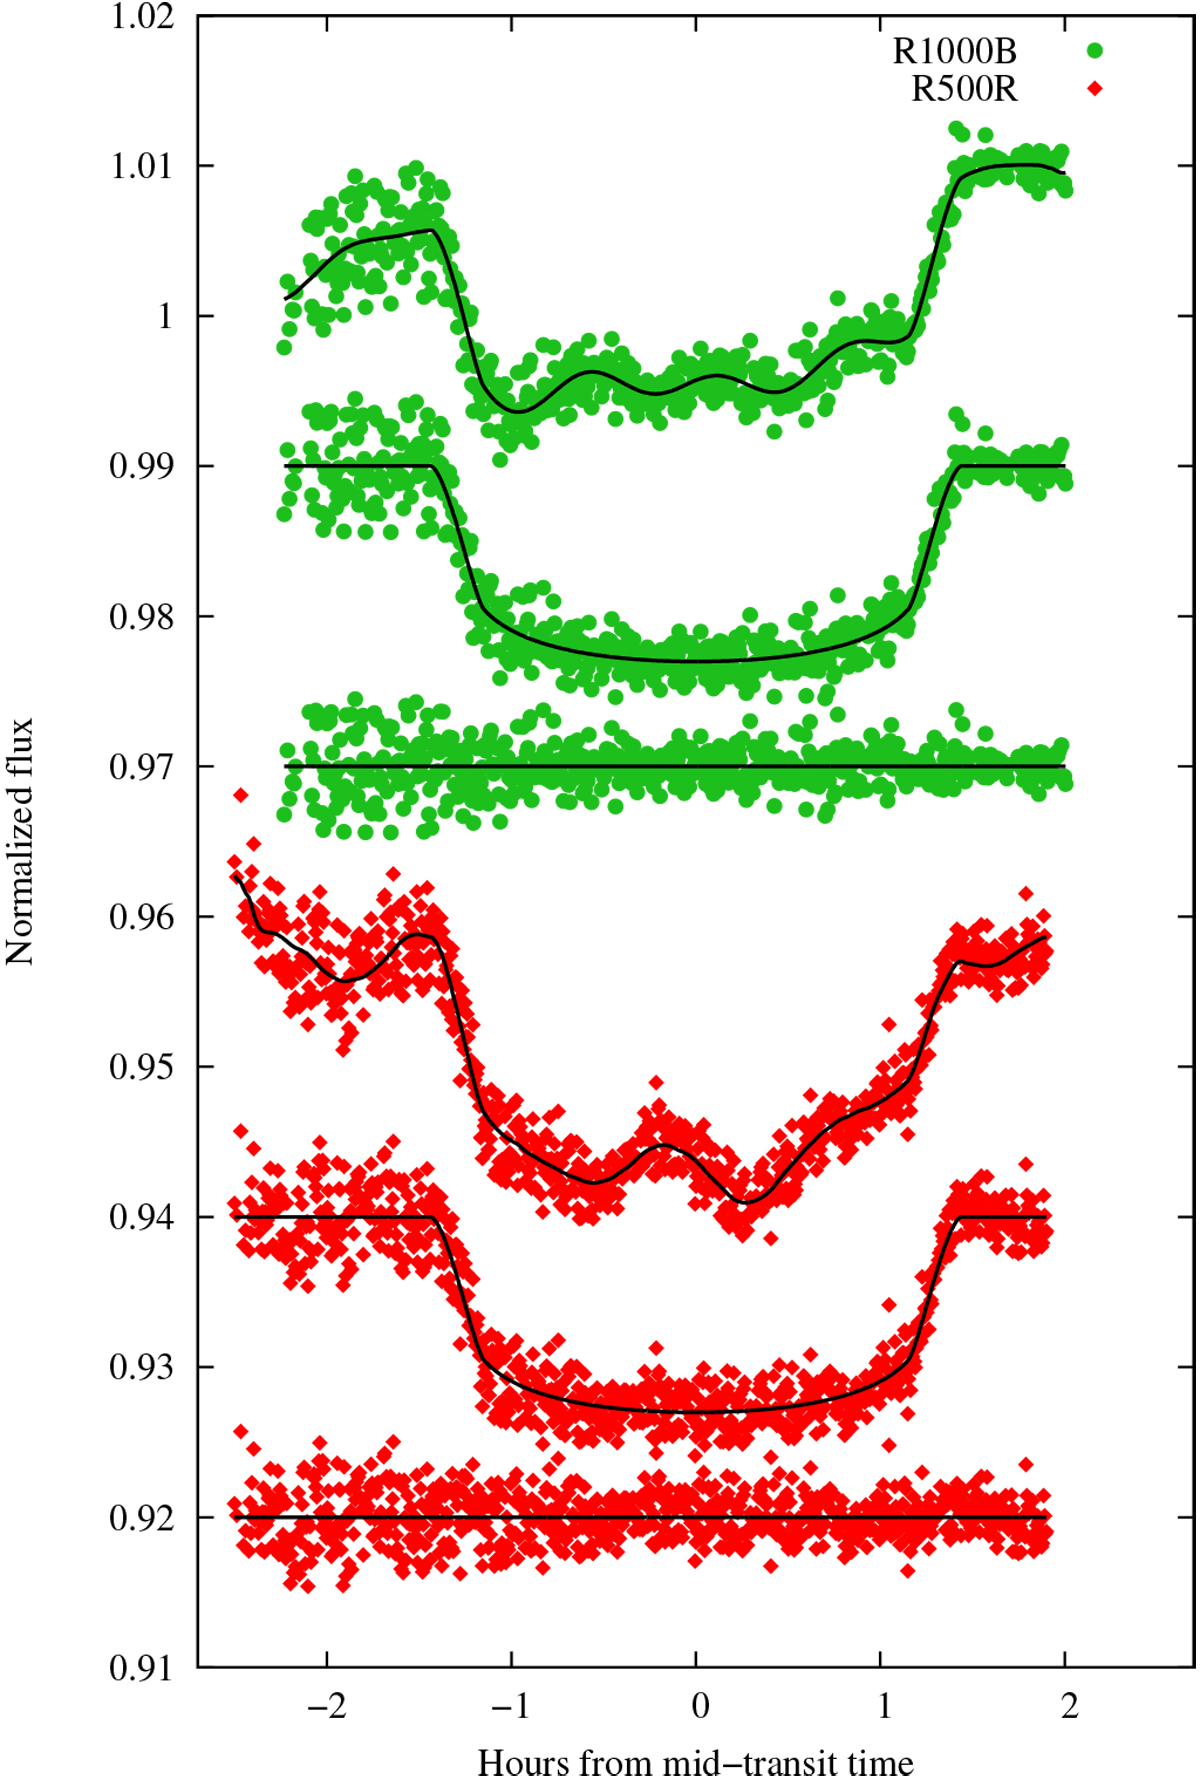
White light curves of WASP-33 b obtained with the GTC, artificially shifted for visual inspection. Green filled circles correspond to OR1, and red filled diamonds to OR2. Each OR is presented in three sections, described from top to bottom as follows: the raw photometry along with the best-fit model in black continuous line, the transit light curve after the pulsations and detrending models are subtracted, along with the best-fit transit model in black continuous line, and the residual light curves on the bottom.
Current usage metrics show cumulative count of Article Views (full-text article views including HTML views, PDF and ePub downloads, according to the available data) and Abstracts Views on Vision4Press platform.
Data correspond to usage on the plateform after 2015. The current usage metrics is available 48-96 hours after online publication and is updated daily on week days.
Initial download of the metrics may take a while.