Free Access
Fig. 2
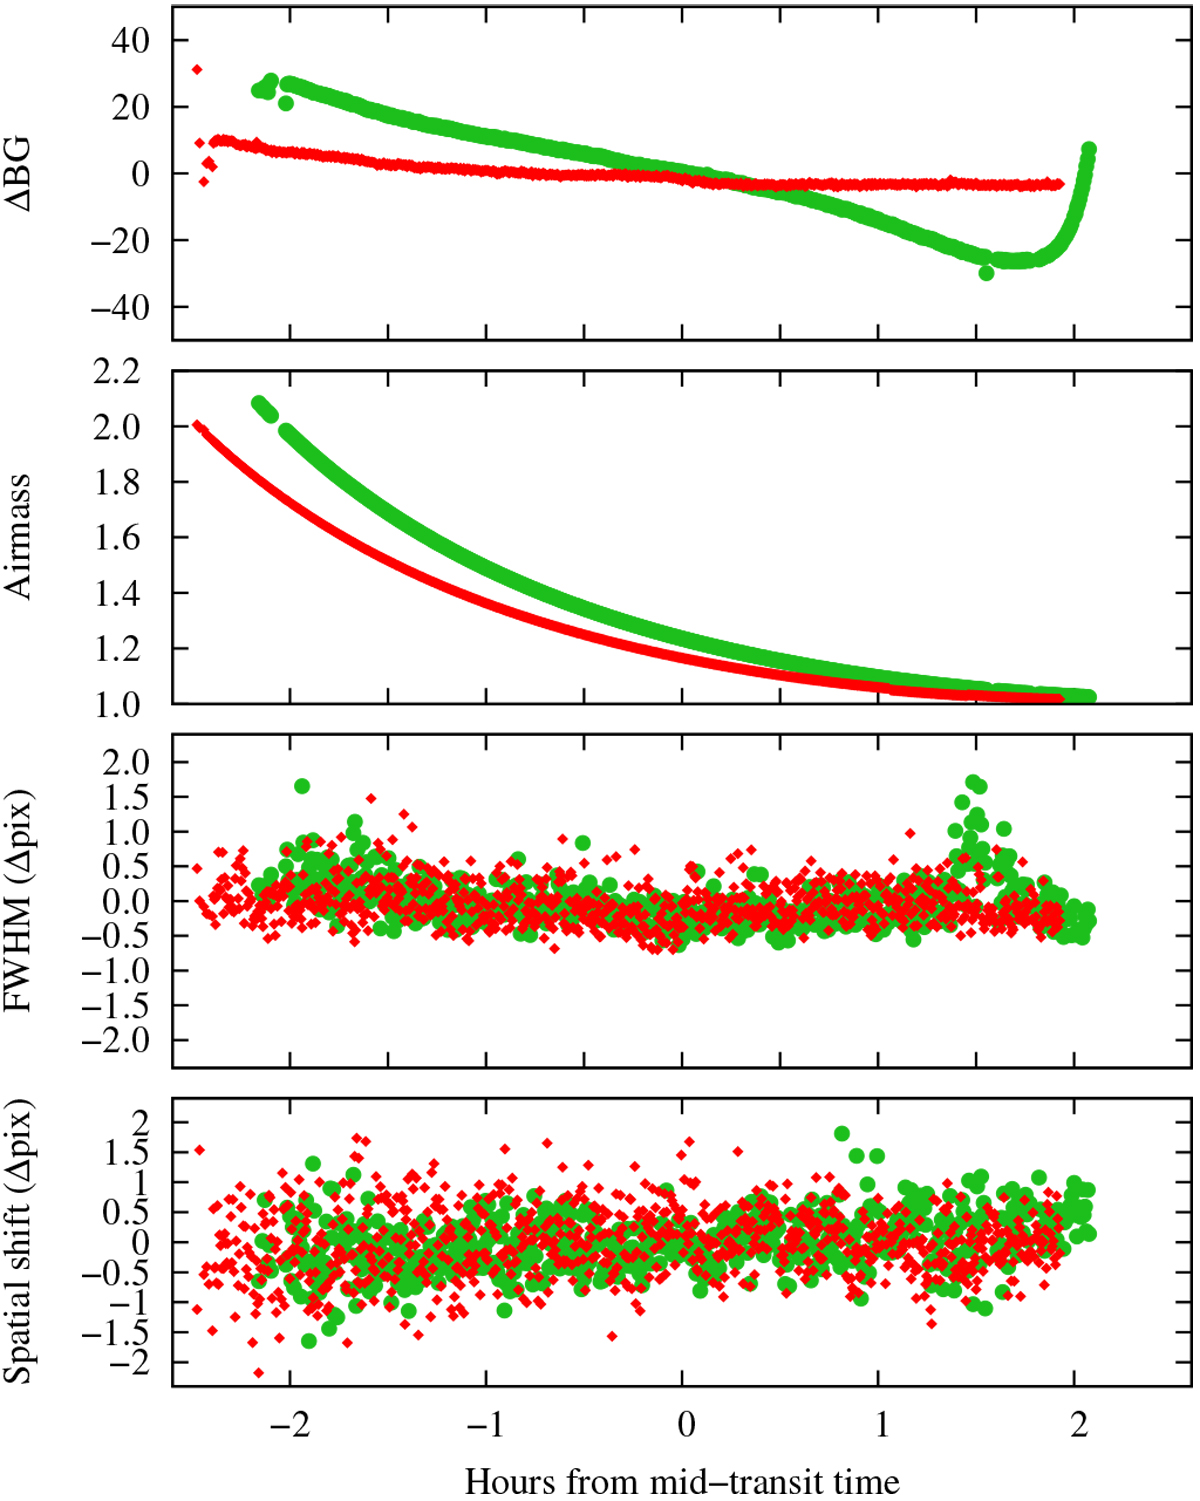
From top to bottom: time-dependent changes of background counts (BG), airmass, FWHM, and spatial shifts. Both data sets have been shifted to their respective mid-transit times, and are shown in hours. Large green circles correspond to the R1000B (OR1) data, while small red diamonds correspond to R500R (OR2).
Current usage metrics show cumulative count of Article Views (full-text article views including HTML views, PDF and ePub downloads, according to the available data) and Abstracts Views on Vision4Press platform.
Data correspond to usage on the plateform after 2015. The current usage metrics is available 48-96 hours after online publication and is updated daily on week days.
Initial download of the metrics may take a while.