Free Access
Fig. 5.
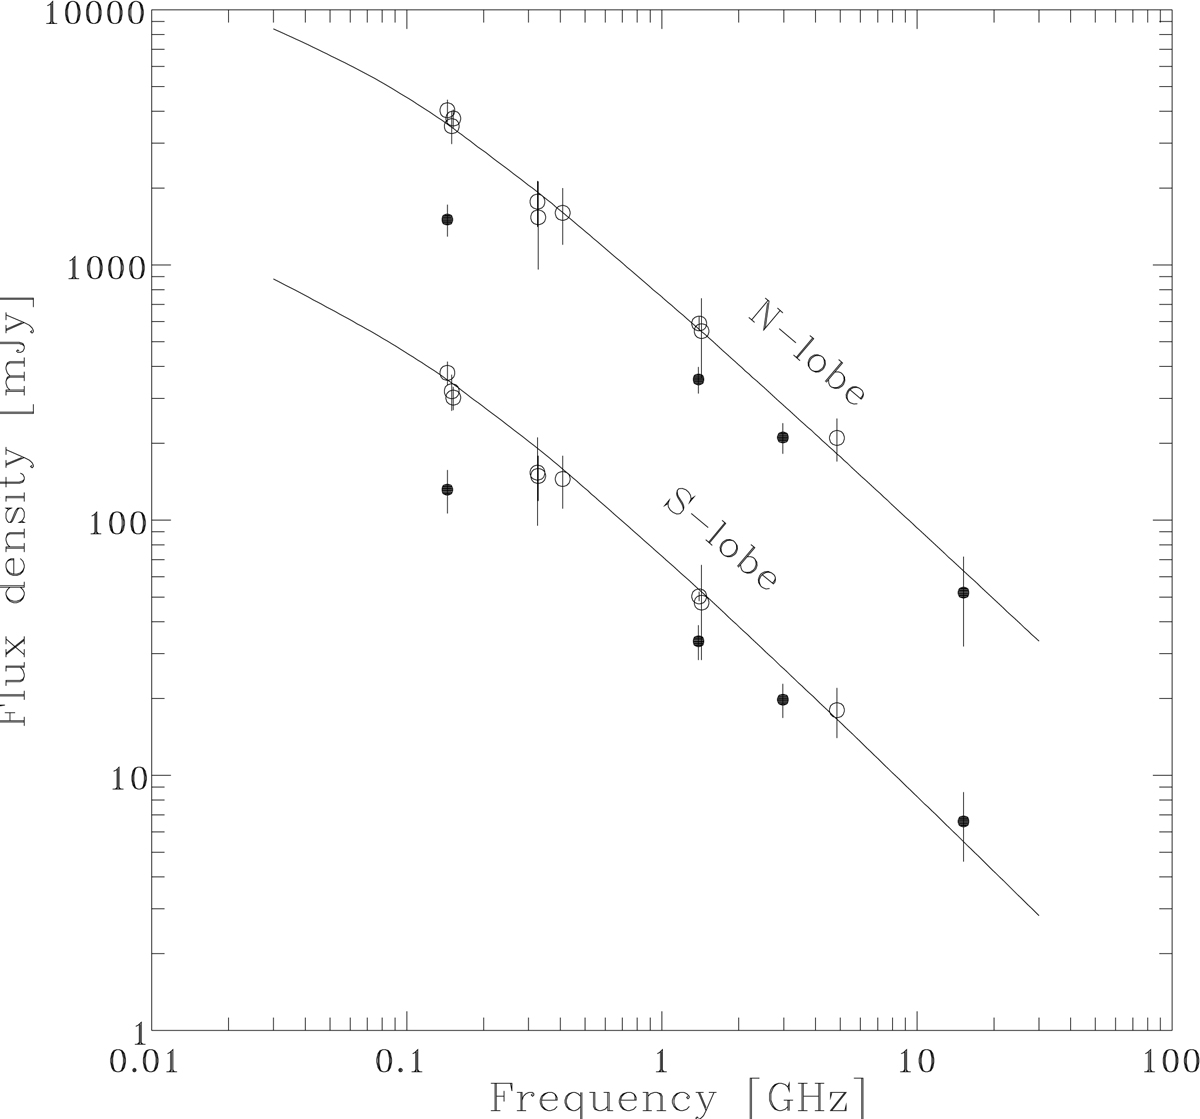
DYNAGE fits (solid lines) to the total intensity spectra of the north-west and south-east lobes (open circles), and the spectral points of the hotspot regions (filled dots; not used in the fits). Note that the north-west lobe flux density scale is shifted one decade up in relation to the given ordinate scale.
Current usage metrics show cumulative count of Article Views (full-text article views including HTML views, PDF and ePub downloads, according to the available data) and Abstracts Views on Vision4Press platform.
Data correspond to usage on the plateform after 2015. The current usage metrics is available 48-96 hours after online publication and is updated daily on week days.
Initial download of the metrics may take a while.