Fig. 3.
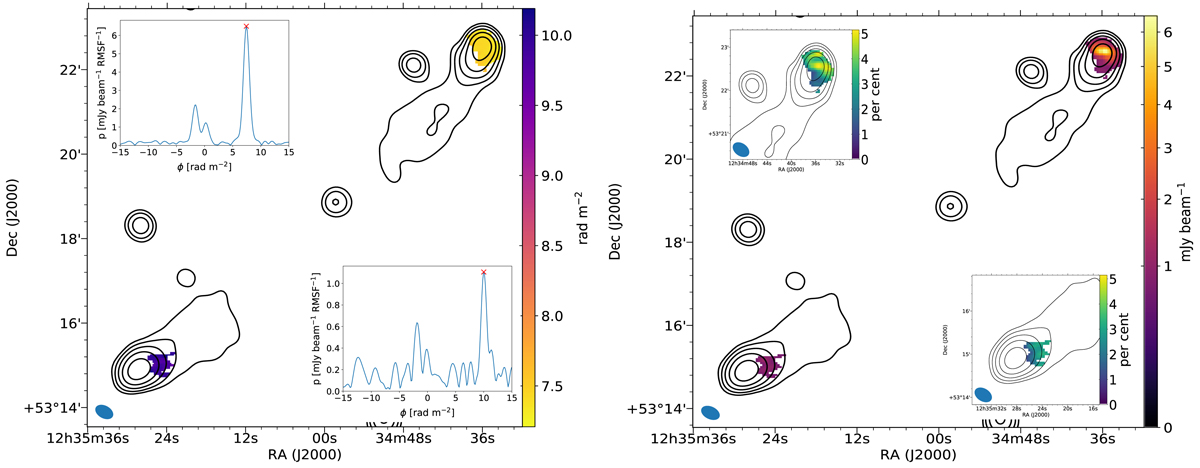
Left image: main image: Faraday rotation measure distribution (colour scale) of the north-west (NW) and south-east (SE) lobe regions that are detected above the threshold of 8σQU, overlaid by the total intensity contours starting at 5 mJy beam−1 and increasing in factors of two. Insets: The absolute value of the RMCLEAN Faraday dispersion function for the brightest polarised pixel in the NW lobe (top) and SE lobe (bottom). Right image: main image: polarised intensity greyscale, in mJy beam−1, overlaid by the total intensity contours. Insets: degree of polarisation colourscale (in per cent) from zoomed in regions of the NW and SE lobes.
Current usage metrics show cumulative count of Article Views (full-text article views including HTML views, PDF and ePub downloads, according to the available data) and Abstracts Views on Vision4Press platform.
Data correspond to usage on the plateform after 2015. The current usage metrics is available 48-96 hours after online publication and is updated daily on week days.
Initial download of the metrics may take a while.