Fig. 2.
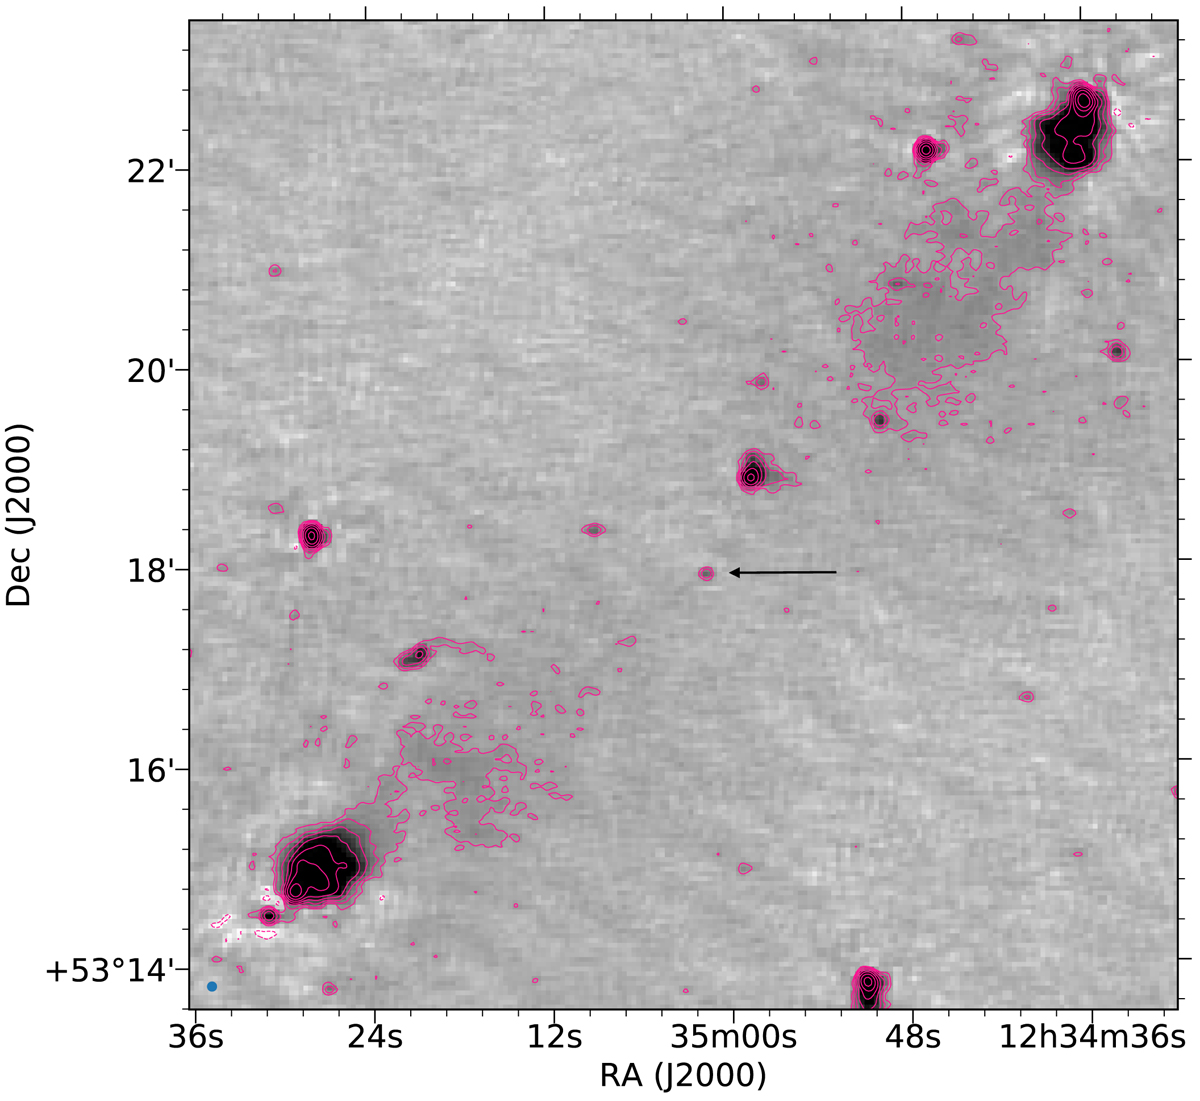
LoTSS total intensity image at 144 MHz at 6′′ resolution (after direction-dependent calibration). The contours start at 300 μJy beam−1 and increase by factors of 2 (with one negative contour at −300 μJy beam−1). The greyscale image is tuned to show the noise variation across the image (∼70 μJy beam−1 away from bright sources and ∼100 μJy beam−1 near the hotspots), as well as a faint hint of the south-east jet. The radio galaxy core coincident with the host galaxy SDSS J123501.52+531755.0 is indicated by the horizontal arrow. The synthesised beam size is shown in the bottom left hand corner of image.
Current usage metrics show cumulative count of Article Views (full-text article views including HTML views, PDF and ePub downloads, according to the available data) and Abstracts Views on Vision4Press platform.
Data correspond to usage on the plateform after 2015. The current usage metrics is available 48-96 hours after online publication and is updated daily on week days.
Initial download of the metrics may take a while.