Fig. 3.
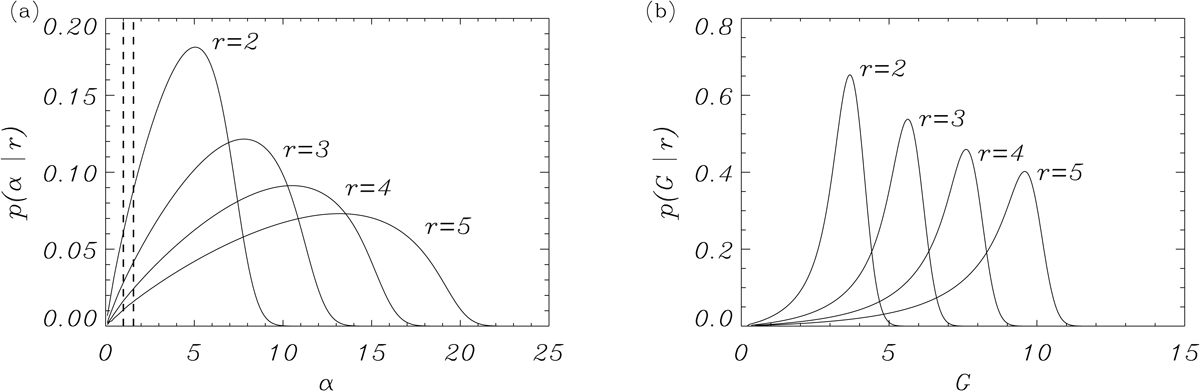
Marginal posteriors for panels aα and bG for different values of the damping ratio r = τd/P obtained by inversion of Eqs. (16) and (13) and by considering them as additional parameters together with ζ and l/R. In panel a the vertical dashed lines indicate the values α = 1 (linear density model) and α = π/2 (sinusoidal density model). The mean and error at 68% credible intervals for the posteriors in panel a are: ![]() for r = 2;
for r = 2; ![]() for r = 3;
for r = 3; ![]() for r = 4; and
for r = 4; and ![]() for r = 5. The mean and error at 68% credible intervals for the posteriors in panel b are:
for r = 5. The mean and error at 68% credible intervals for the posteriors in panel b are: ![]() for r = 2;
for r = 2; ![]() for r = 3;
for r = 3; ![]() for r = 4; and
for r = 4; and ![]() for r = 5. In all computations the error in damping ratio is fixed to σ = 0.2.
for r = 5. In all computations the error in damping ratio is fixed to σ = 0.2.
Current usage metrics show cumulative count of Article Views (full-text article views including HTML views, PDF and ePub downloads, according to the available data) and Abstracts Views on Vision4Press platform.
Data correspond to usage on the plateform after 2015. The current usage metrics is available 48-96 hours after online publication and is updated daily on week days.
Initial download of the metrics may take a while.