Free Access
Fig. 8.
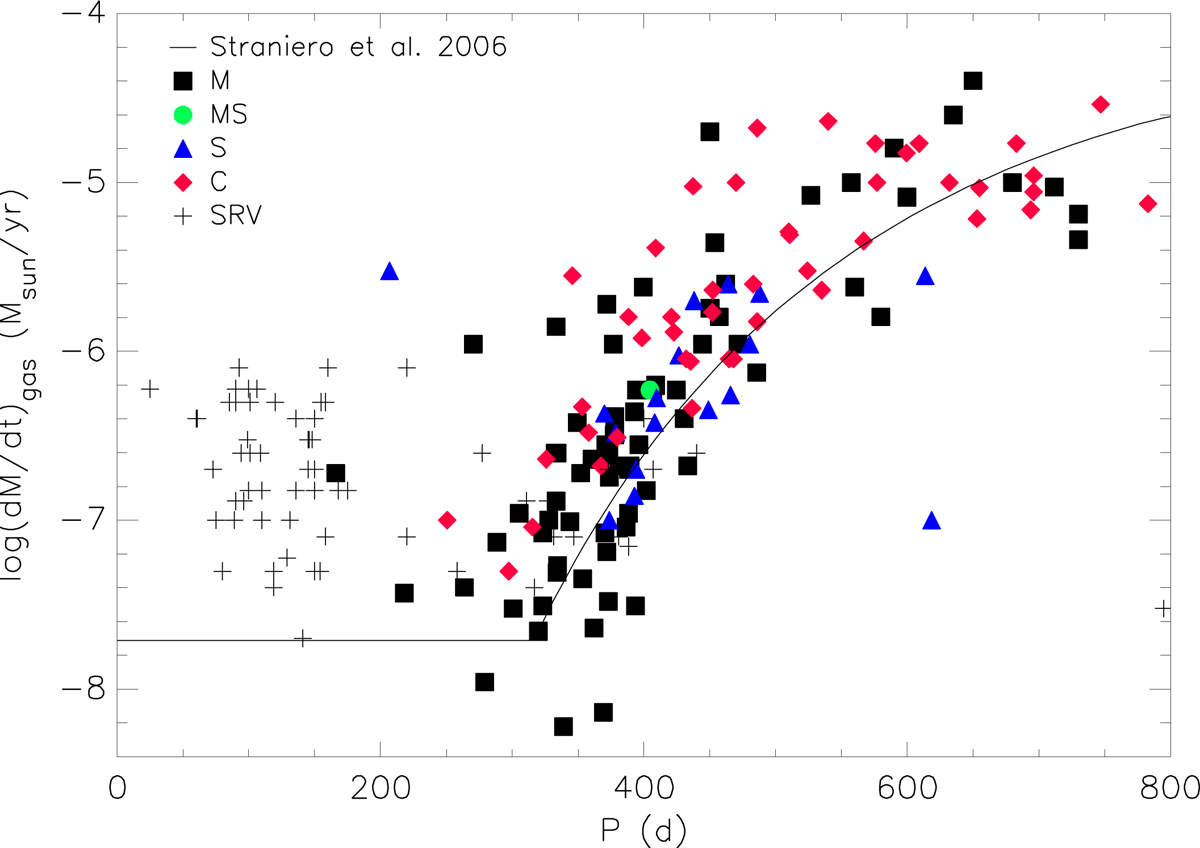
Gas mass-loss rate log(Ṁg) as a function of pulsation period for Miras in Table A.2 and SRVs from Olofsson et al. (2002). The solid line is the empiric period – mass-loss-rate relation of Straniero et al. (2006). Two SRVs with no known period are plotted at P = 25 d.
Current usage metrics show cumulative count of Article Views (full-text article views including HTML views, PDF and ePub downloads, according to the available data) and Abstracts Views on Vision4Press platform.
Data correspond to usage on the plateform after 2015. The current usage metrics is available 48-96 hours after online publication and is updated daily on week days.
Initial download of the metrics may take a while.