Fig. 7.
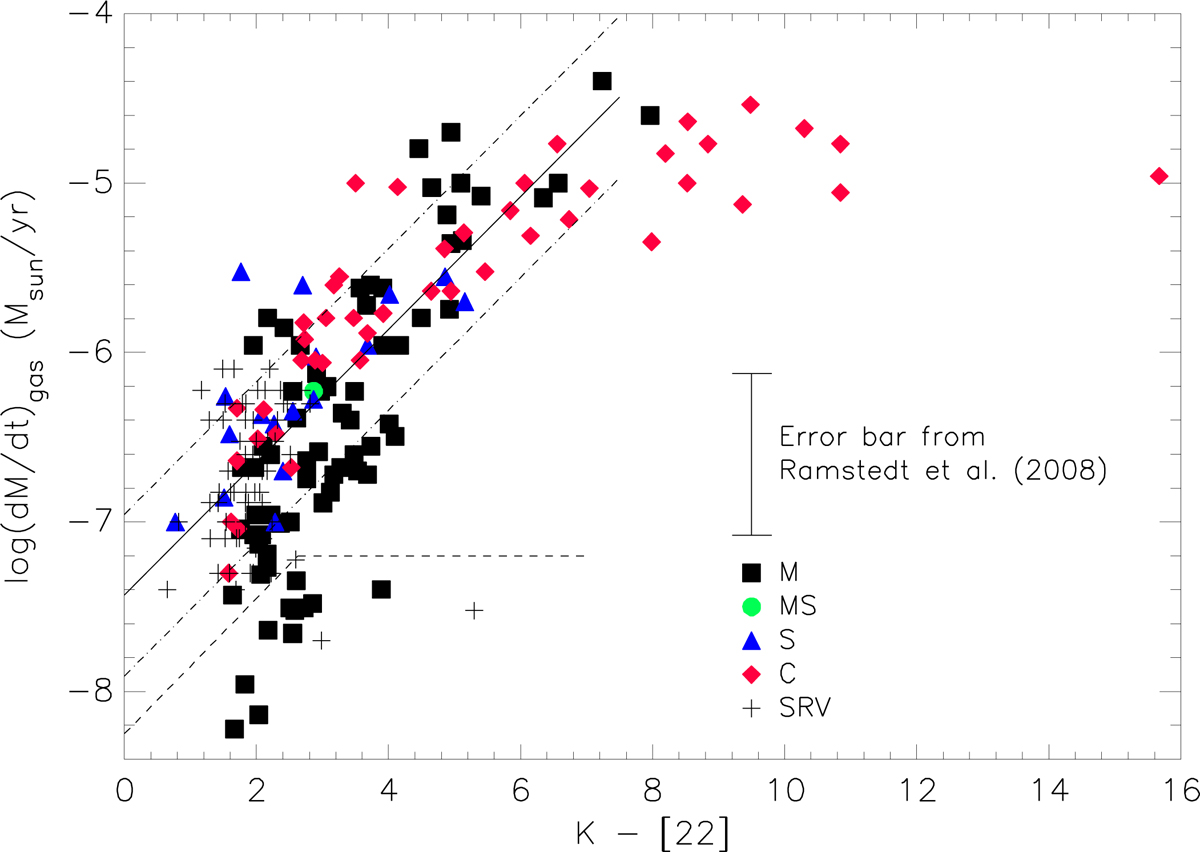
Gas mass-loss rate log(Ṁg) as a function of K − [22] of the collection of AGB stars in Table A.2. The data of Mira stars are plotted as different symbols according to their spectral type, see the legend in the lower right corner of the diagram. SRVs from Olofsson et al. (2002) are plotted as black crosses; they are all of spectral type M. Stars to the lower right of the black dashed line as well as stars redder than K − [22]=7.5 have been excluded from the ordinary least-squares fit that is shown as the black solid line. The dash-dotted lines show the fit moved up and down by the estimated factor-of-3 uncertainty (Ramstedt et al. 2008).
Current usage metrics show cumulative count of Article Views (full-text article views including HTML views, PDF and ePub downloads, according to the available data) and Abstracts Views on Vision4Press platform.
Data correspond to usage on the plateform after 2015. The current usage metrics is available 48-96 hours after online publication and is updated daily on week days.
Initial download of the metrics may take a while.