Fig. 6.
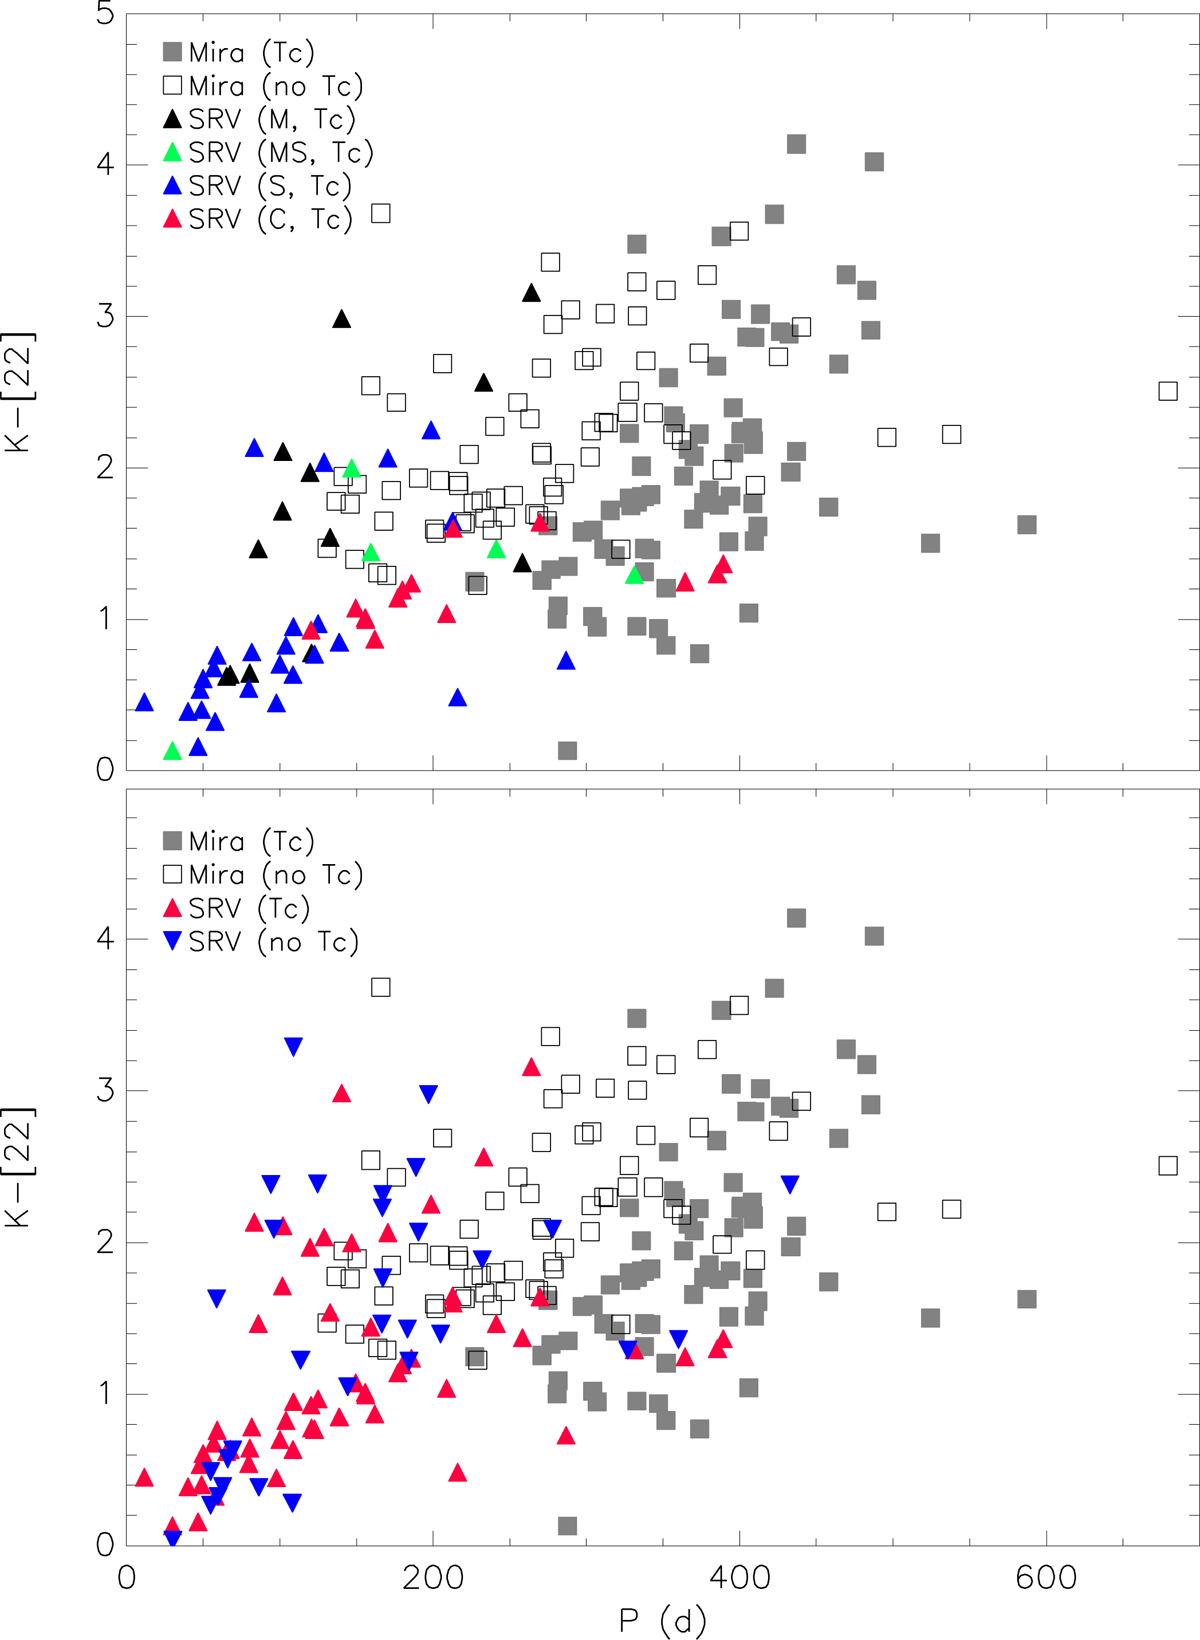
Upper panel: P vs. K − [22] diagram including Tc-rich SRVs (triangles). Different spectral types are colour-coded, see legend. Lower panel: same as upper panel, but showing M-type Tc-poor (downward-pointing blue triangles) and Tc-rich (upward-pointing red triangles) SRVs. Mira stars are shown in both panels as open and filled grey squares.
Current usage metrics show cumulative count of Article Views (full-text article views including HTML views, PDF and ePub downloads, according to the available data) and Abstracts Views on Vision4Press platform.
Data correspond to usage on the plateform after 2015. The current usage metrics is available 48-96 hours after online publication and is updated daily on week days.
Initial download of the metrics may take a while.