Fig. 3.
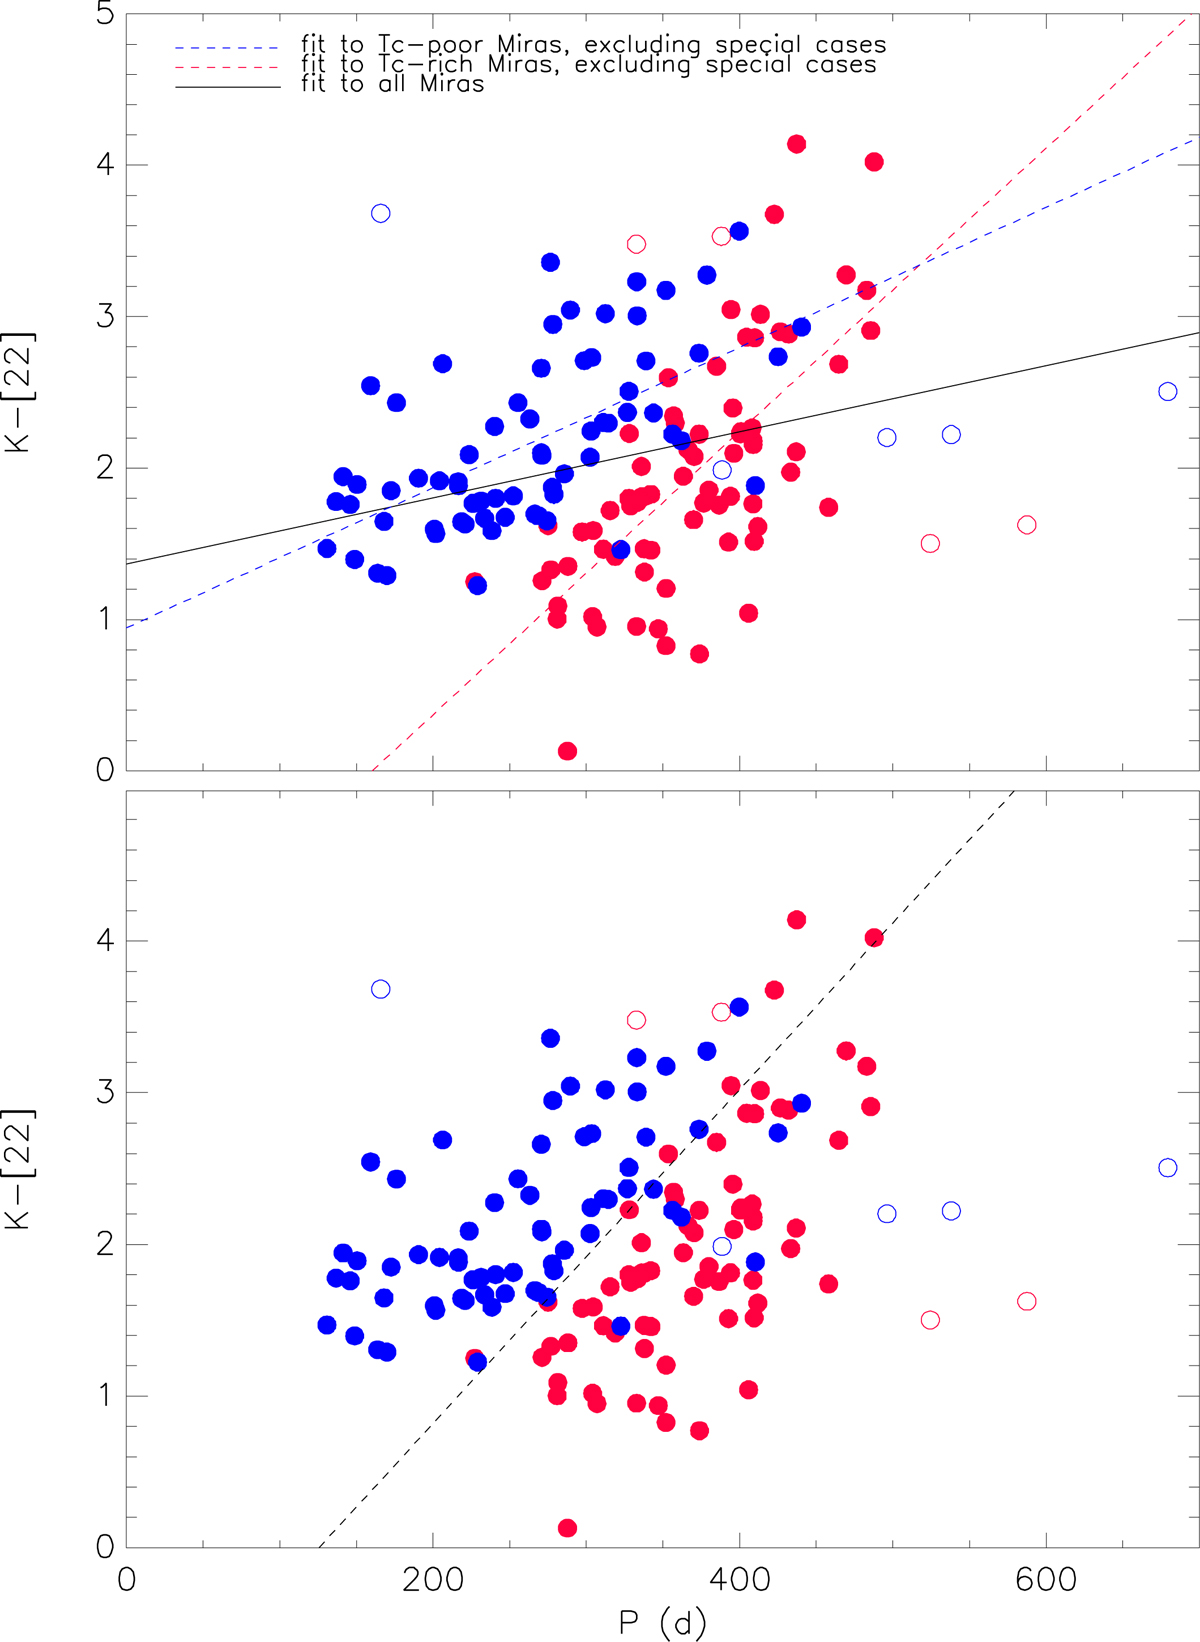
Upper panel: P vs. K − [22] diagram with linear least-squares fits to different sub-samples of Miras. Blue dashed line: Fit to the Tc-poor Miras (filled blue circles), excluding the identified outliers (open circles, see text). Red dashed line: Same for the Tc-rich Miras (filled and open red circles, respectively). Black solid line: Fit to all Miras. Lower panel: P vs. K − [22] diagram with the linear relation that best separates Tc-poor from Tc-rich Miras (Eq. 1).
Current usage metrics show cumulative count of Article Views (full-text article views including HTML views, PDF and ePub downloads, according to the available data) and Abstracts Views on Vision4Press platform.
Data correspond to usage on the plateform after 2015. The current usage metrics is available 48-96 hours after online publication and is updated daily on week days.
Initial download of the metrics may take a while.