Fig. 15.
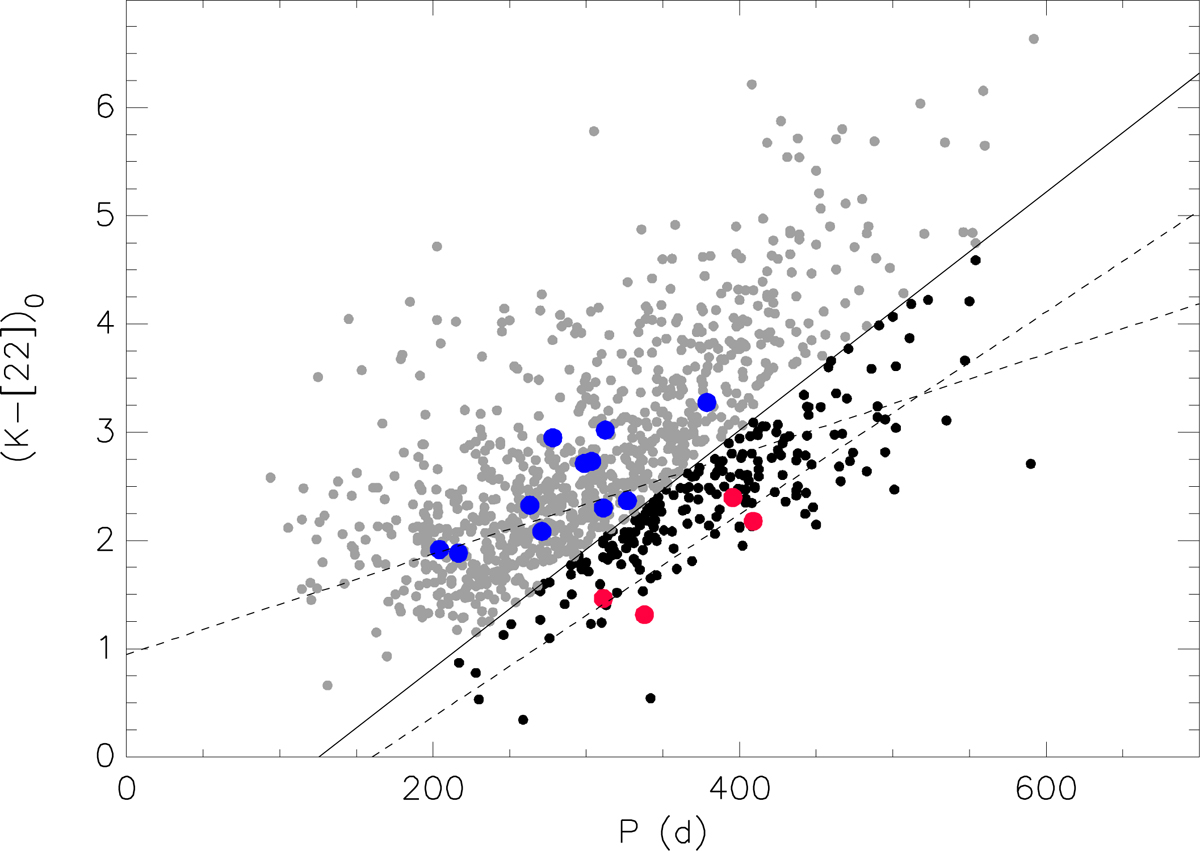
P vs. (Ks − [22])0 diagram of 1091 MACHO Galactic bulge Miras from Bernhard & Hümmerich (2013). The solid line is the relation that was found to best separate Tc-poor from Tc-rich stars (Eq. (1)). MACHO Miras falling above this line, i.e. putative Tc-poor stars, are plotted as grey symbols, whereas Miras below the line, i.e. putative Tc-rich stars, as black symbols. Large symbols represent the Plaut stars analysed for their Tc content in Uttenthaler et al. (2007; blue: Tc-poor, red: Tc-rich). The dashed lines are the linear fits to the Tc-poor and Tc-rich Miras from the upper panel of Fig. 3.
Current usage metrics show cumulative count of Article Views (full-text article views including HTML views, PDF and ePub downloads, according to the available data) and Abstracts Views on Vision4Press platform.
Data correspond to usage on the plateform after 2015. The current usage metrics is available 48-96 hours after online publication and is updated daily on week days.
Initial download of the metrics may take a while.