Free Access
Fig. 14.
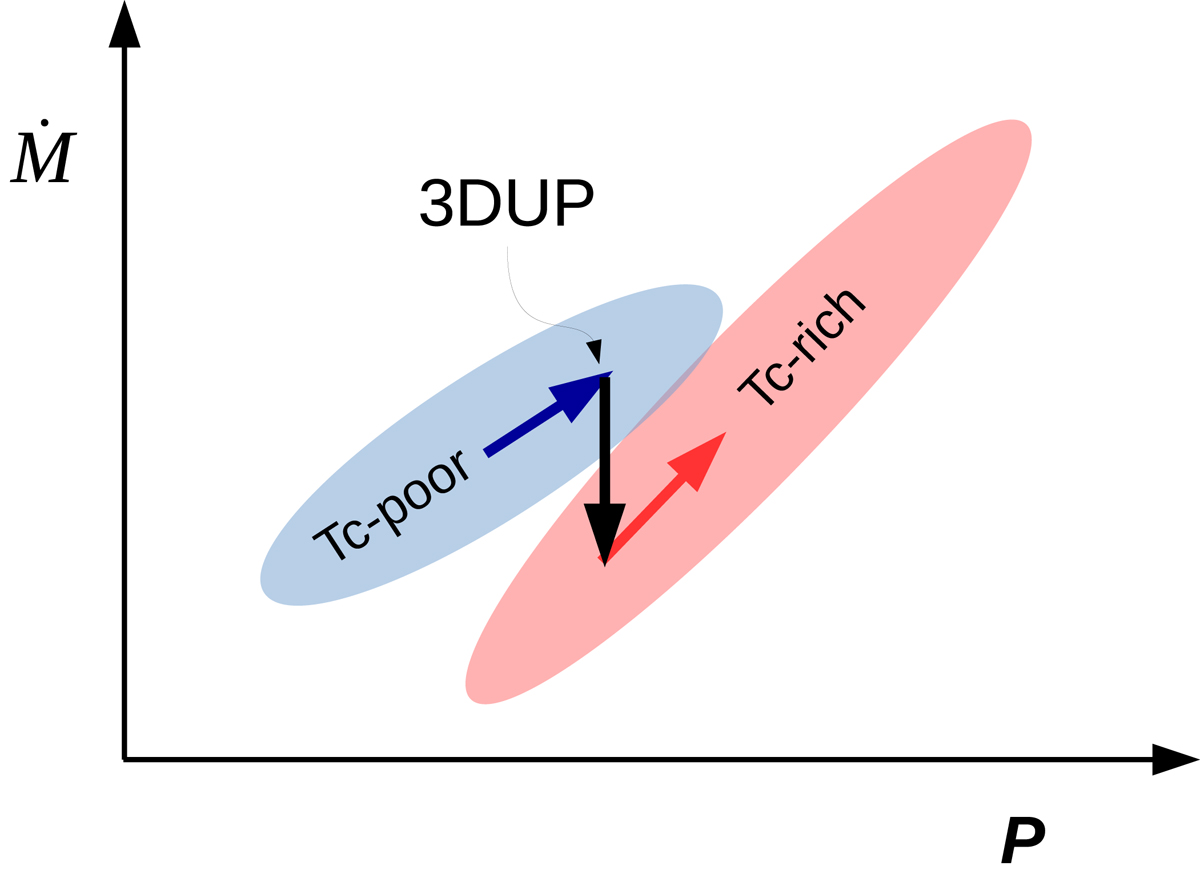
Schematic illustration of the evolution of a Mira in the Ṁ vs. P diagram under the assumption of hypothesis 3 (thick arrows): The stellar mass-loss rate decreases upon 3DUP, while the period stays constant. The shaded areas indicate the observed sequences of Tc-poor and Tc-rich Miras (Fig. 2).
Current usage metrics show cumulative count of Article Views (full-text article views including HTML views, PDF and ePub downloads, according to the available data) and Abstracts Views on Vision4Press platform.
Data correspond to usage on the plateform after 2015. The current usage metrics is available 48-96 hours after online publication and is updated daily on week days.
Initial download of the metrics may take a while.