Free Access
Fig. 10.
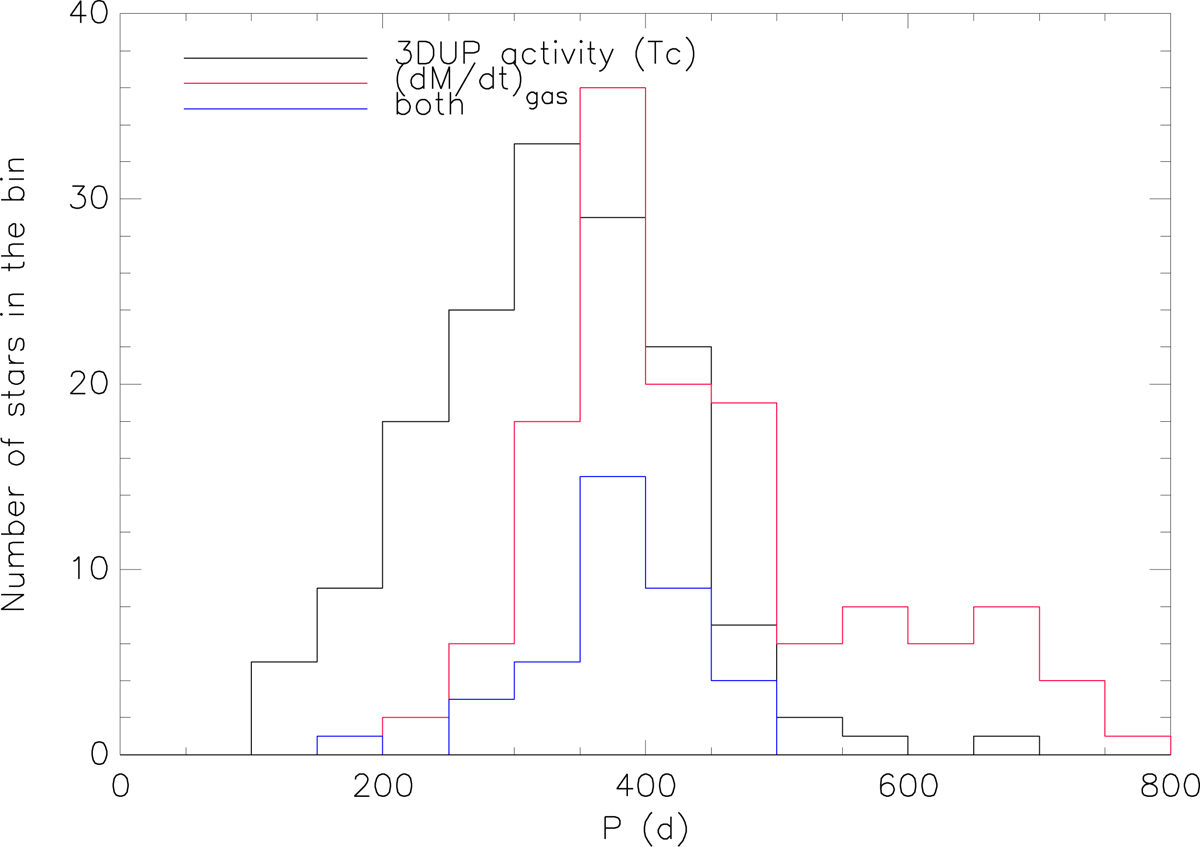
Period distribution of Miras with information on their 3DUP activity (black histogram), of Miras with a measured gas mass-loss rate (red), and of Miras with information on both (blue). Observational biases are the probable cause of the different distributions.
Current usage metrics show cumulative count of Article Views (full-text article views including HTML views, PDF and ePub downloads, according to the available data) and Abstracts Views on Vision4Press platform.
Data correspond to usage on the plateform after 2015. The current usage metrics is available 48-96 hours after online publication and is updated daily on week days.
Initial download of the metrics may take a while.