Fig. 9.
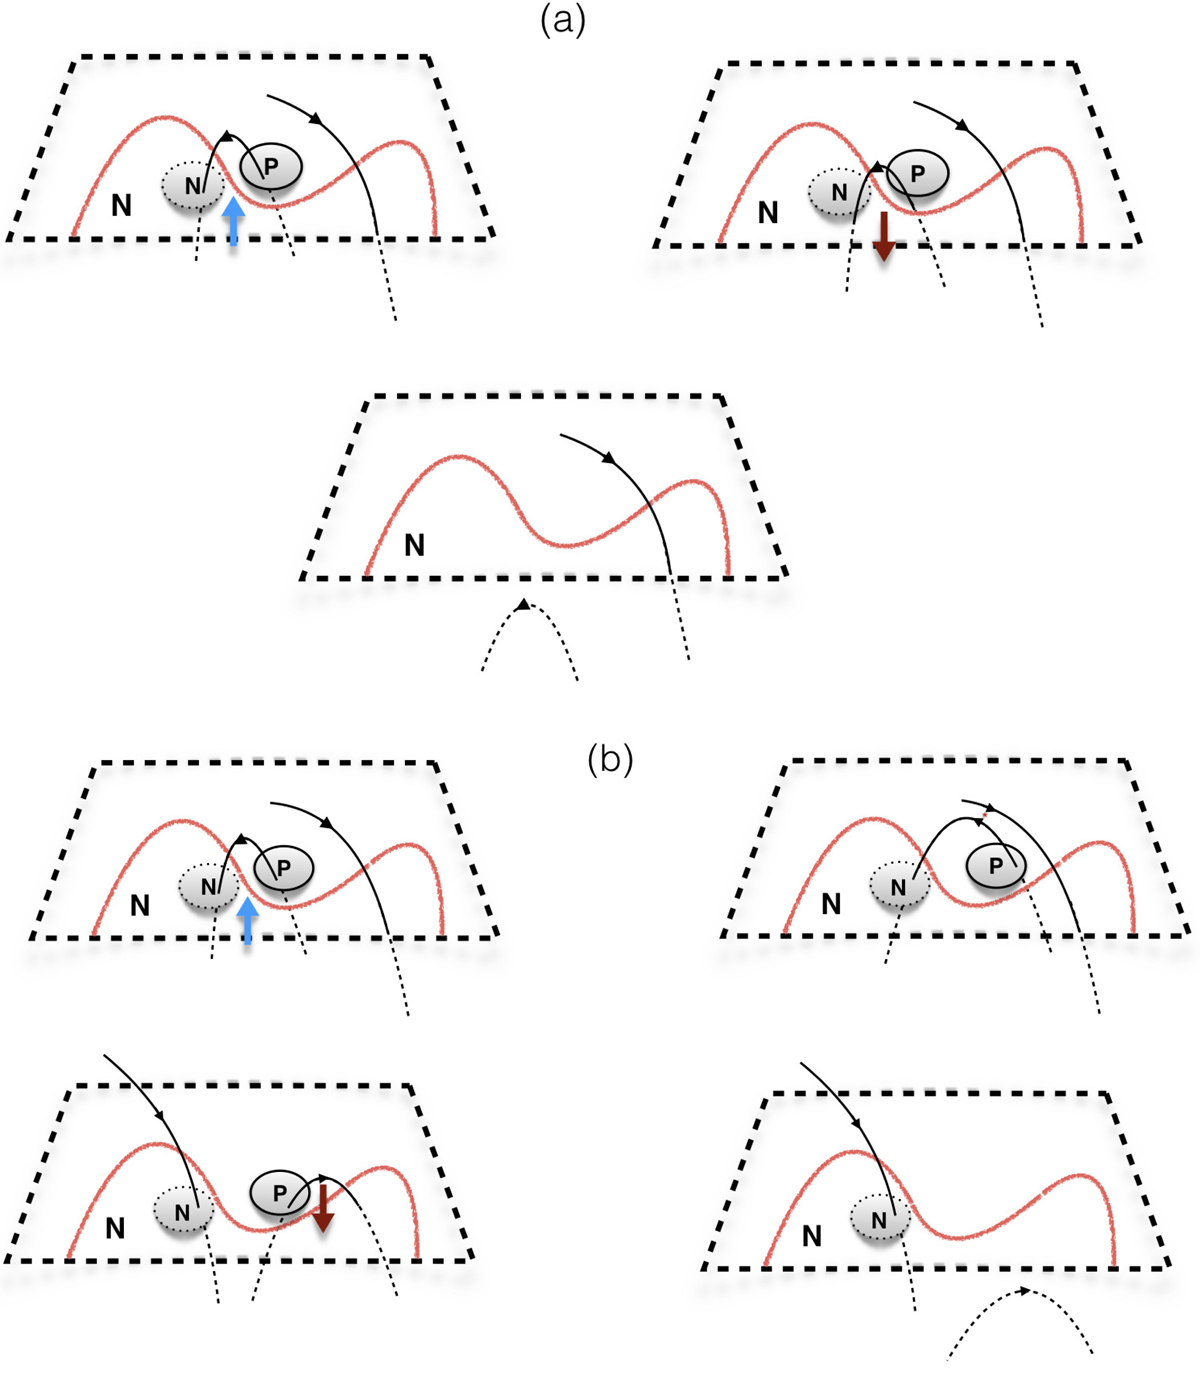
Cartoon of the possible scenarios underlying Class I cancelation events. Panel a: emergence followed by flux retraction. Panel b: emergence, then reconnection followed by submergence. The bold dashed rectangle represents a part of the solar surface. N and P indicate negative and positive magnetic polarity. The solid and dotted ovals represent the newly emerged bipole. The red line represents the boundary of the pre-existing large magnetic feature. Solid black lines are parts of field lines above the solar surface, dashed lines are parts below it. Blue and red arrows indicate up- and downflows.
Current usage metrics show cumulative count of Article Views (full-text article views including HTML views, PDF and ePub downloads, according to the available data) and Abstracts Views on Vision4Press platform.
Data correspond to usage on the plateform after 2015. The current usage metrics is available 48-96 hours after online publication and is updated daily on week days.
Initial download of the metrics may take a while.