Free Access
Fig. 8.
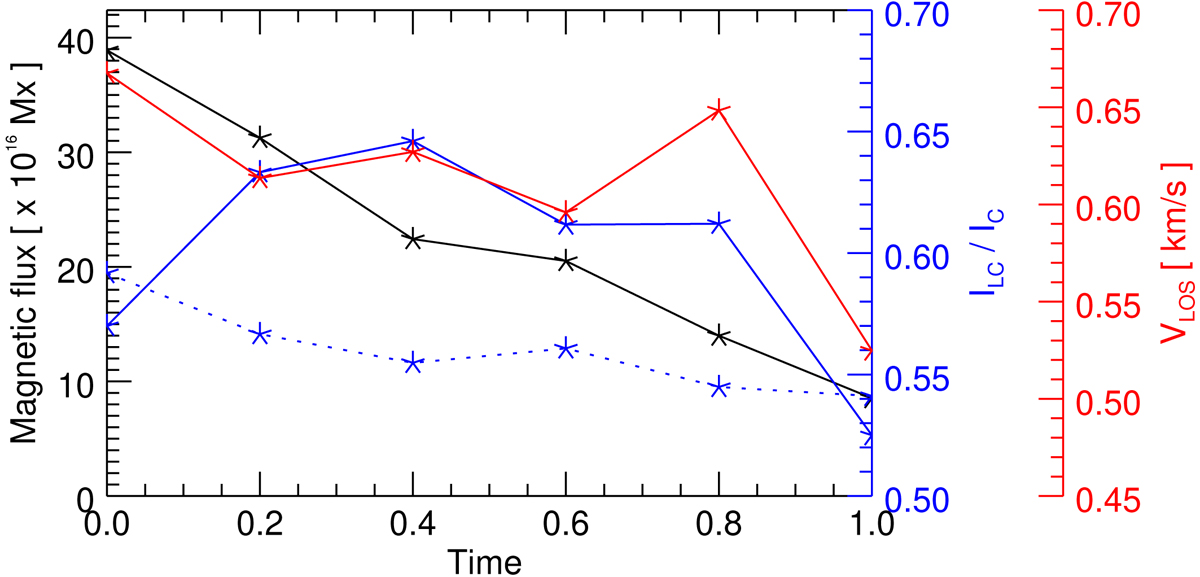
Same as Fig. 4, but for the five canceling pairs belonging to Class II. Average Doppler velocity of the representative feature (see text for details) is plotted in red. The blue line represents the mean line core intensity along the PIL.
Current usage metrics show cumulative count of Article Views (full-text article views including HTML views, PDF and ePub downloads, according to the available data) and Abstracts Views on Vision4Press platform.
Data correspond to usage on the plateform after 2015. The current usage metrics is available 48-96 hours after online publication and is updated daily on week days.
Initial download of the metrics may take a while.