Fig. 7.
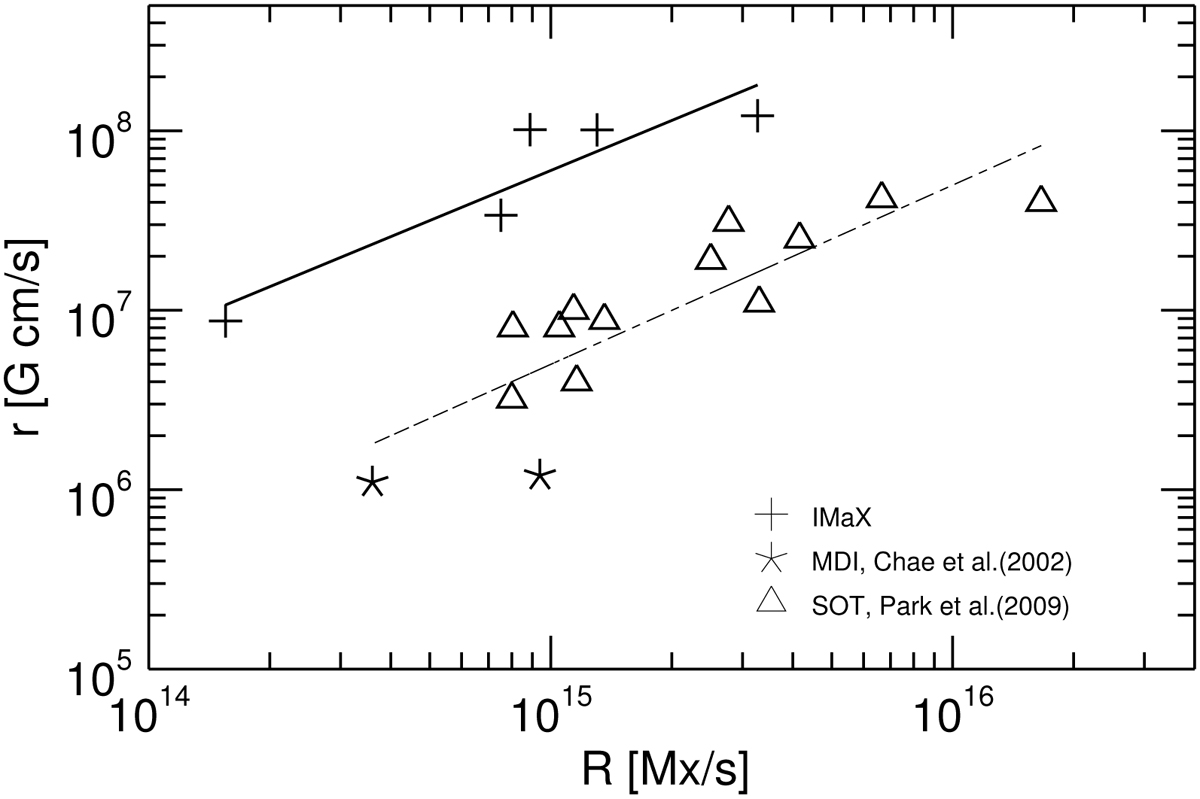
Flux decay rates (R) and specific cancelation rates (r) of Class II canceling pairs (+symbols). The asterisks, triangles represent r values from Chae et al. (2002) and Park et al. (2009), respectively. The solid line is a regression to the IMaX data, and the dashed line fits data from Park et al. (2009). These fits have been plotted mainly to guide the eye.
Current usage metrics show cumulative count of Article Views (full-text article views including HTML views, PDF and ePub downloads, according to the available data) and Abstracts Views on Vision4Press platform.
Data correspond to usage on the plateform after 2015. The current usage metrics is available 48-96 hours after online publication and is updated daily on week days.
Initial download of the metrics may take a while.