Fig. 6.
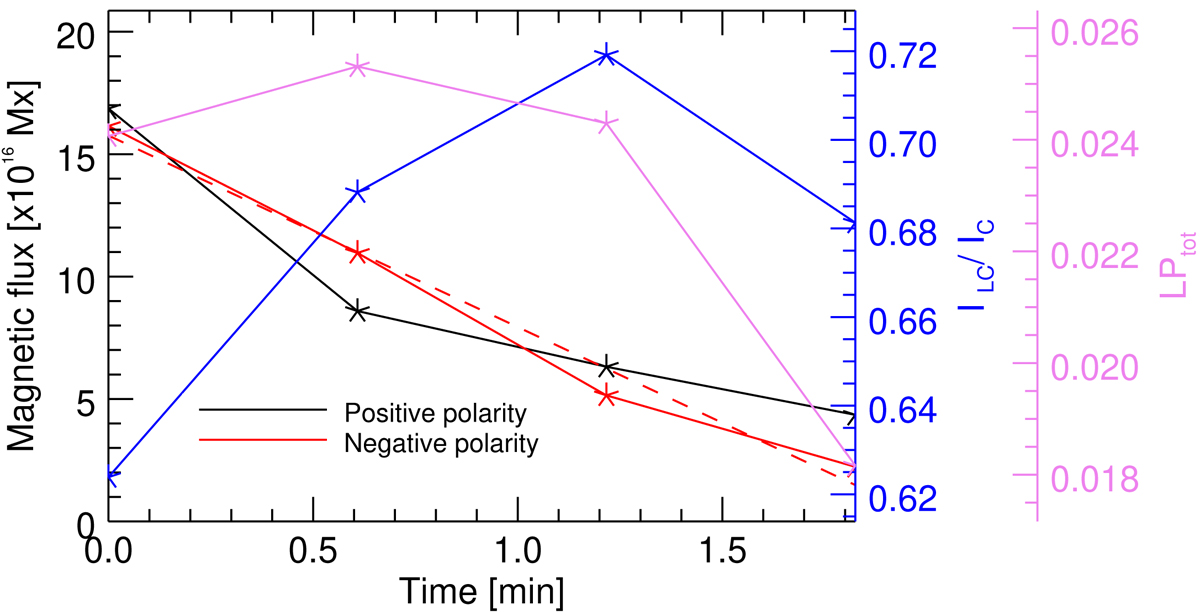
Same as the Fig. 3, but for Class II cancelation event in ROI 9. The black (red) solid line represents the evolution of total magnetic flux of the positive (negative) patch. The dashed red line is the linear fit to the flux curve of the negative patch. Variation of total linear polarization (LPtot) averaged over the PIL is plotted in magenta. The normalized line-core intensity is plotted in blue.
Current usage metrics show cumulative count of Article Views (full-text article views including HTML views, PDF and ePub downloads, according to the available data) and Abstracts Views on Vision4Press platform.
Data correspond to usage on the plateform after 2015. The current usage metrics is available 48-96 hours after online publication and is updated daily on week days.
Initial download of the metrics may take a while.